Mon Jan 01, 2018 News on map-projections.net
Updated on Mon Jan 10, 2022
What better way to start a new year than updating your website?
;-)
Modified Images for the Tissot Indicatrix
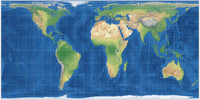
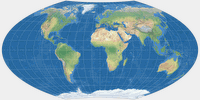
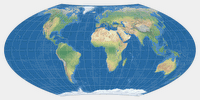
Starting with the projections I added today (see below), I will use modified images for the Tissot indicatrix. I changed the colours in order to achieve better contrasts; the graticule (which is helpful in evaluating distortions) is more emphasized; and I removed the artifacts on the coastlines:
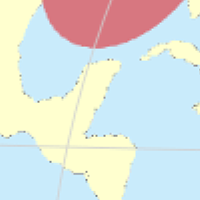
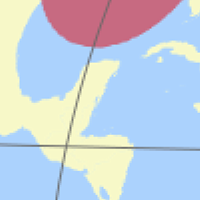
However, I will use these images only for new projections, so
the existing Tissot images will not be replaced. At least not in the
foreseeable future
– that would be a lot of work, and since the previous images
are not really bad in my opinion, it is not worth the effort.
Maybe one day I’ll take the time to replace the old ones… but
maybe not.
Update Jan 10, 2022:
And four years later, I finally took the time – the old Tissot renderings
have finally been replaced by the new ones for all projections!
New projections: Business before pleasure
Firstly, I added a series of new projections, although, to be honest, I didn’t really want to.
They all are cylindrical equal-area map projections.
In my opinion, that’s a kind of projection that can/should be used rarely:
If you want an equal-area map, do not use a cylindrical projection.
If you want a cylindrical map, do not use an equal-area projection.
Forcing an equivalent projection into rectangular shape inevitably leads to considerable distortion of
the shapes. In my opinion, the advantages of a rectangular map are not big enough to accept these distortions.
Moreover, all cylindrical equal-area projections differ in one
regard only, namely the selected standard parallel. I find it quite unnecessary to
assign eight individual names if, in the end, it is the same projection method,
changing only one single parameter.
Granted: Most of these projections were created at a time when drawing a
new map with a modified standard parallel was much more complicated than typing in
an arbitrary value between 0 and 90, clicking a button and waiting for the projection
software to finish rendering the map. So, maybe the different names
are justified, even if it may seem a bit awkward from today’s point of view.
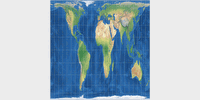
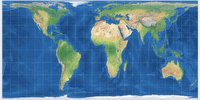
But on the other hand, map-projections.net was created specifically to compare similar projections and to be able to discover their sometimes very slight differences. So what am I talking around? – Here are the newly added, cylindrical equal-area projections: Balthasart, Smyth, Tobler’s world in a square and Trystan-Edwards (in the variant that was corrected by John P. Snyder) [1].
Now, for the part that was more fun than the above compulsory exercise.
The van der Grinten I is already included on this website since it was
launched. Two and a half years later it is due time to add
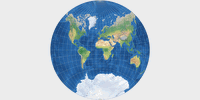
the less frequently used van der Grinten II, III and IV.
The numbering may be a little
confusing because of the fact that
– the projections I and IV were presented in 1904 by
Alphons J. van der Grinten himself;
– projections II and III were published years later. They are modifications of the
van der Grinten I, which Alois Bludau introduced in 1912
[2].
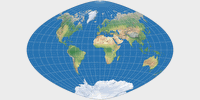
While working on van der Grinten additions, I came across the arithmetic mean of
van der Grinten I and the Aitoff projection, which John J. G. Savard shows
at quadibloc.com since 2007.
Somehow, I liked this blend, so I made my own variant of it – in this
case the weighting of the two mixed projections is shifted to
65% Aitoff and 35% van der Grinten.
Because of this mixing ratio, I named this experiment
Aitoff-van-der-Grinten 65. I don’t think it’s well-suited
for any purposes except decorative maps.
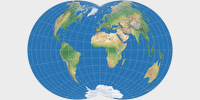
… and the van der Grinten IV with its two wings or cusps or whatever you like to call it (I always call them cell division projections; but only if no one is listening) has led me to the Dietrich-Kitada [3], which is an equal-area projection:
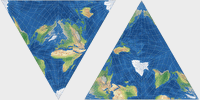
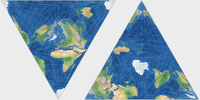
Next, I added three very unusual equal-area projections: Snyder’s
tetrahedral projection, as well as two variants created by van Leeuwen/Strebe
[4],
the Parallel Small Circle Projection and the Vertex-oriented Great Circle Projection.
The latter one will be handled in the near future in an own blog post.
Since I always present the projections on this website in a rectangle with
an aspect ratio of 1:2 and the tetrahedral projections only occupy a small part
of this rectangle, I show them twice: once on the north polar aspect and once centered to the
south pole.
The two van Leeuwen variants are really hard to distinguish. Hint: Look at the graticule lines, not the continents. Wouldn’t it be great if there was a website to compare such similar projections? Oh wait, there is! ;-)
Who would want a strange projection like this?
Well, actually they aren’t tetrahedral but polyhedral projections which just have been applied
to a tetrahedron here.
Polyhedral projections can – like e.g. the Dymaxion Map
or several other variants
[5]
– be used to build interrupted maps having low distortions.
Moreover, they look interesting and can be fun, when you use them to build papercraft pseudo-globes.
[6]
And finally…
Gee, I already have so many Wagner-variants on my website!
Nevertheless, two more will be added.
When I presented my own projection experiment,
Wagner-Denoyer I, I stated four goals. Quoting myself:
I wanted to create a projection that meets the following conditions:
- Showing the poles as a line,
- not moving too far away from equivalence,
- the outer meridians shouldn’t bend too much,
- and most importantly, I wanted a decent shape for Africa as well as Greenland.
I’m fully aware that the latter three conditions are highly subjective, e.g. what I feel is a »decent shape« might look terribly distorted to someone else. (…)
Now I was curious to see if I would succeed in creating another projection with these goals.
I decided to maintain another feature of Wagner-Denoyer I, namely the slight curvature of the parallels.
But this time I wanted to use Wagner’s method of Umbeziffern.
In other words, generating a variation of Wagner VII/VIII.
(See: Umbeziffern – The Wagner transformation method and
the WVG-7).
So I fired up the WVG-7, chose Wagner-Denoyer I as background projection image,
and approached it first by setting a similar curvature of parallels, length of the pole line
and extent of area inflation.
As expected, this interim result was not quite what I had in mind (simply because the Wagner-Denoyer
has a different graticule characteristic than a modified Wagner VII/VIII).
So I carefully adjusted the configuration parameters until I came up with a result that I
liked. The outer meridians are more curved than in the Wagner-Denoyer, but
still correspond to my idea of being »not too curved«.
The comparatively small area inflation of 1.14 at 60° N/S gave me the idea to try an equal-area variant. So I completely removed the area inflation and then modified the length of the pole line and the ratio of the axis again to achieve the above-mentioned goals.
Did I get usable results?
I don’t know.
I like them, and that’s all I care about. ;-)
Instead of giving them fine-sounding names, I simply applied the extended Böhm notation,
so they are listed as Wagner vii@73-46-60-60-14-206 (the compromise projection)
and Wagner vii@70-46-60-0-216 (the equal-area projection). Here they are:
… and yes, I was presumptuous enough to list myself as (co-) author of the three »new« projections (the Aitoff/v. d. Grinten mix and the two Wagner variations). But, hey, other people name projections after themselves just because they have set a specific standard parallel. So I can probably mention myself when I’ve tinkered a bit on the configuration parameters. ;-)
Is there anything left to say?
Oh yes: Happy New Year!
References
-
↑
Snyder, John P.:
Flattening the Earth: Two Thousand Years of Map Projections.
Chicago 1993, p. 165:Another choice of standard parallels was made by Trystan Edwards (1953) of England when he tried to limit the »coefficient«» of distortion (which he defined as the ratio of the scale factor along the meridian to that along the parallel at a given point) in a zone between the Tropic of Cancer (23°27´ N latitude) and some more-northern latitude (as well as the corresponding southern zone) to between 4/3 and 3/4. This required that the more-northern latitude be arccos (0.75 cos 23°27´) or 46°31´, with the standard parallel equal to arccos ((sqrt(3)/2) cos 23°27´) or 37°24´, to retain the equal-area feature. Edwards, however, chose a standard parallel of 50°52´, or arccos (0.75 cos2 23°27´), and thus did not achieve the desired distortion characteristics.
I’m using Snyder’s correction here (standard parallel 37°24´), Edward’s original (50°52´) has been omitted. -
↑
see: https://web.archive.org/web/20150906031049/http://www.progonos.com/furuti/MapProj/Normal/ProjOth/projOth.html;
and Snyder loc.cit., S. 259-261 -
↑
Map appears in Bruno Dietrich’s 1927 text. Formulae published by Kōzō Kitada, 1958.
– quoted from the Geocart Manual, available at the Geocart download page.
Presumably this refers to the publication that is cited in Bibliography on Map Projections (Snyder/Stewart 1988; PDF file, 17,5 MB): Kitada, K., 1957, [Creation of new map projection suitable tor the world maps]: Chiri, v. 2, p. 595-602, 1124-1133. [Japanese.] -
↑
van Leeuwen, Diederik / Strebe, Daniel:
A “Slice-and-Dice” Approach to Area Equivalence in Polyhedral Map Projections
in: Cartography and Geographic Information Science, Vol. 33, No. 4, 2006, pp. 269-286
available at a fee: doi.org/10.1559/152304006779500687 - ↑ Review of several polyhedral projections: https://web.archive.org/web/20150906031049/http://www.progonos.com/furuti/MapProj/Normal/ProjPoly/projPoly.html
- ↑ Papercraft pseudo-globes: https://web.archive.org/web/20150906031049/http://www.progonos.com/furuti/MapProj/Normal/ProjPoly/Foldout/foldout.html





 Except where otherwise noted, images on this site are licensed under
Comments
Be the first one to write a comment!