
Thu Dec 24, 2020 The Frančula Projections
Updated on Sat Nov 06, 2021
In the beginning of this year, I added the Györffy E projection to my website. Preparing that blogpost, I read Györffy’s paper[1] where I stumbled across the mentioning of projections that “were created (…) by suitable renumbering of Aitoff and ordinary polyconic”. Now, I’ve written about the Umbeziffern[2] (renumbering) quite a lot, but I had never heard or read that this procedure had been applied to the American Polyconic. So I investigated and found out that in 1971, Nedjeljko Frančula introduced a bunch of projections[3] obtained by Umbeziffern from various parent projections.
And here they are.
Fourteen projections, minimizing distortions by application of the Airy and the Airy-Kavrayskiy criterion.
A few words in advance
Before we start looking at the projections, let me get a few things off my chest…
-
Airy criterion? Airy-Kavrayskiy criterion? What’s that?
Well, I’m not going to explain that. Let’s just say that these are metrics to express the amount of distortions in a map projection. In theory, a map with a low EA (Airy) or low EAK (Airy-Kavrayskiy) value will have low angular and areal distortions. There are other metrics and it has been argued upon which is best.
Frančula decided to use the Airy and Airy-Kavrayskiy and developed projections with minimal distortions according these metrics. It is possible that they fare worse according to other metrics. -
Apart from the usual images showing Tissot’s indicatrix, I can show another visualization of distortions only for two of the projections. That’s a bit of a nuisance since Frančula’s projections are about the minimization of distortions.As of November 2021, there are visualizations of distortions for all Frančula projections in this blogpost. However you can also refer to Frančula’s original text containing visualizations of angular and areal distortions. The text is in German but that shouldn’t keep you from examining images. 😉
In the tables below, I’ll provide the numbers of the Anlage (= attachment, they start at page 72) in Frančula’s paper where you can find the visualizations. When there are two numbers, the first image shows areal, the second angular distortions. There’s no image for the Frančula X. V and XIV, being equal-area projections, of course only have angular distortions. I don’t know why the image for angular distortions also were omitted for some other projections. - The names Frančula I to Frančula XIV are no established designations. As far as I know, there are no established designations. So I just came up with them when I prepared this blogpost. The ordinal numbers correspond to the order in which they are listed in Frančula’s paper.
- The Frančula projections are derived by Umbeziffern from five parenting projections. Four of them have already been used by Wagner, so I’m referring to the corresponding Frančulas as “Wagner variants”.
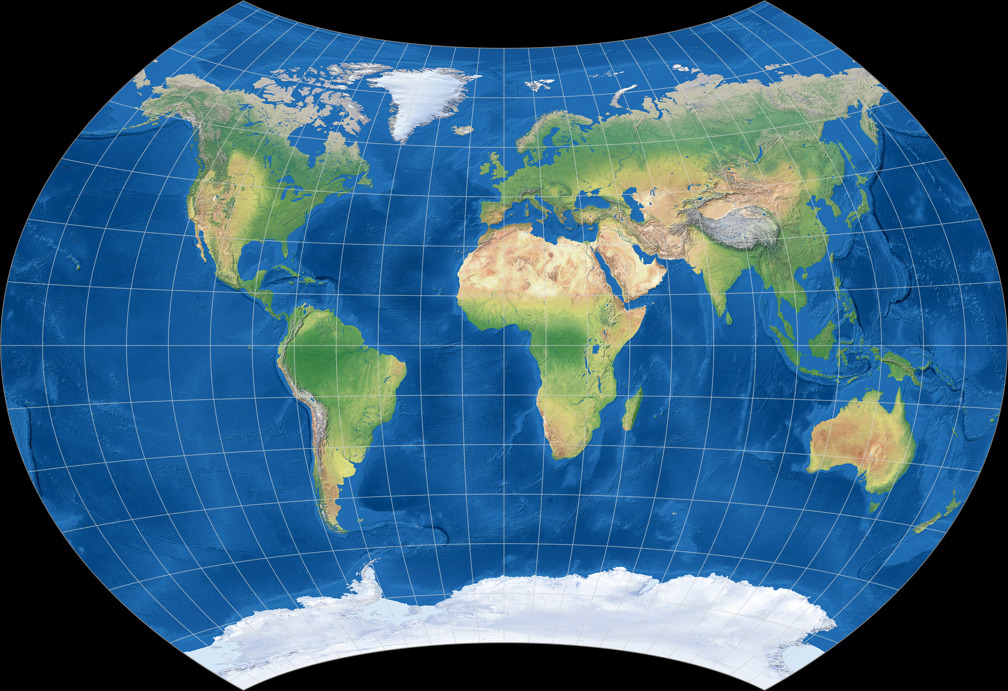
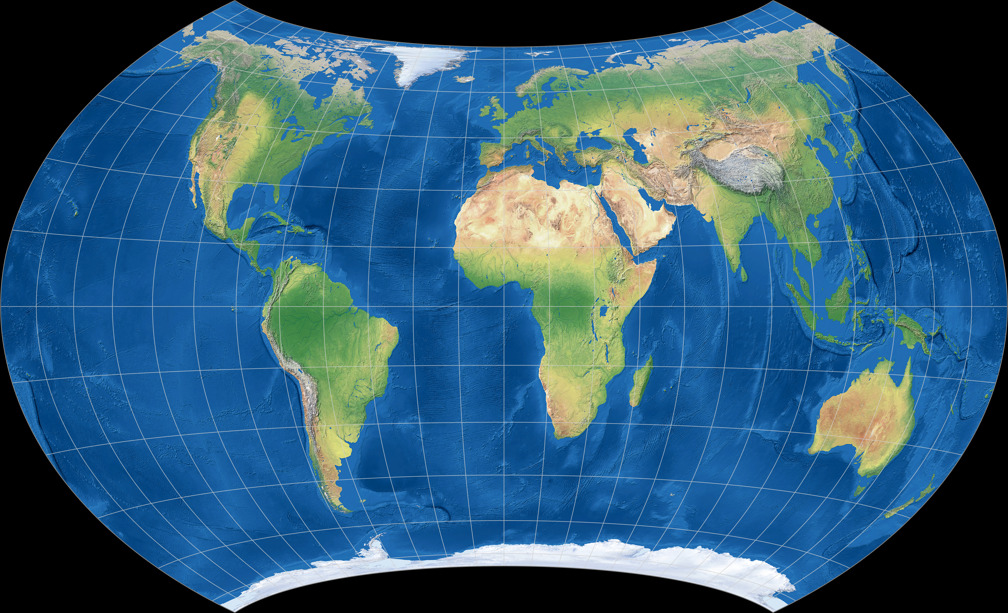
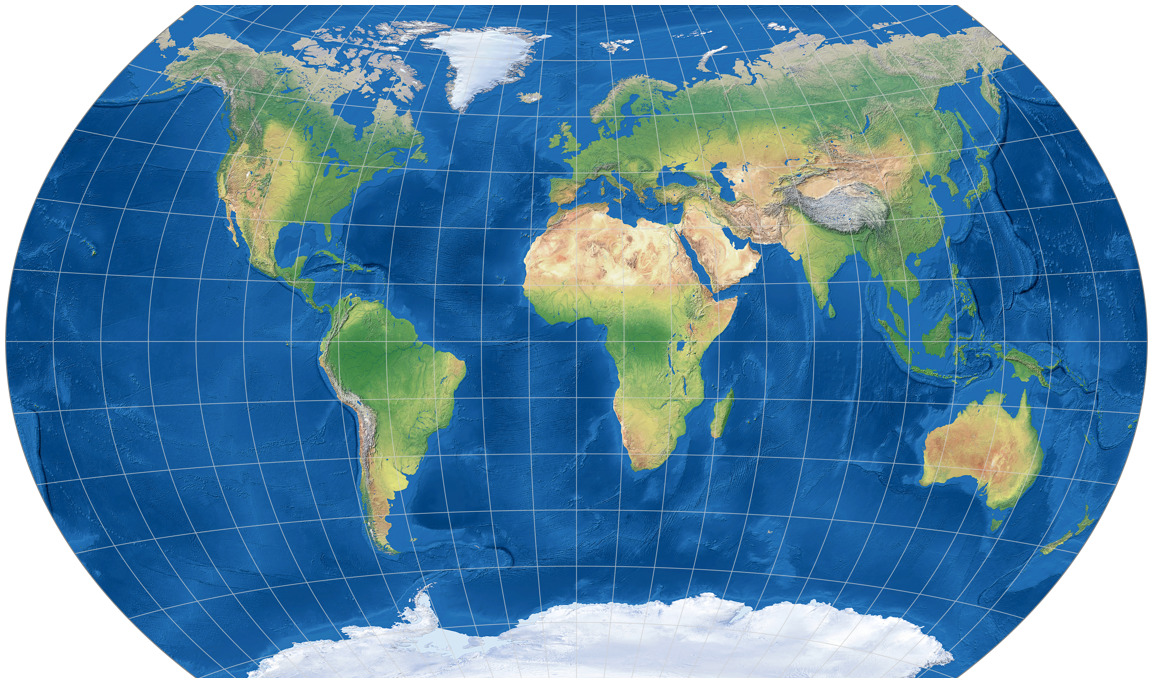
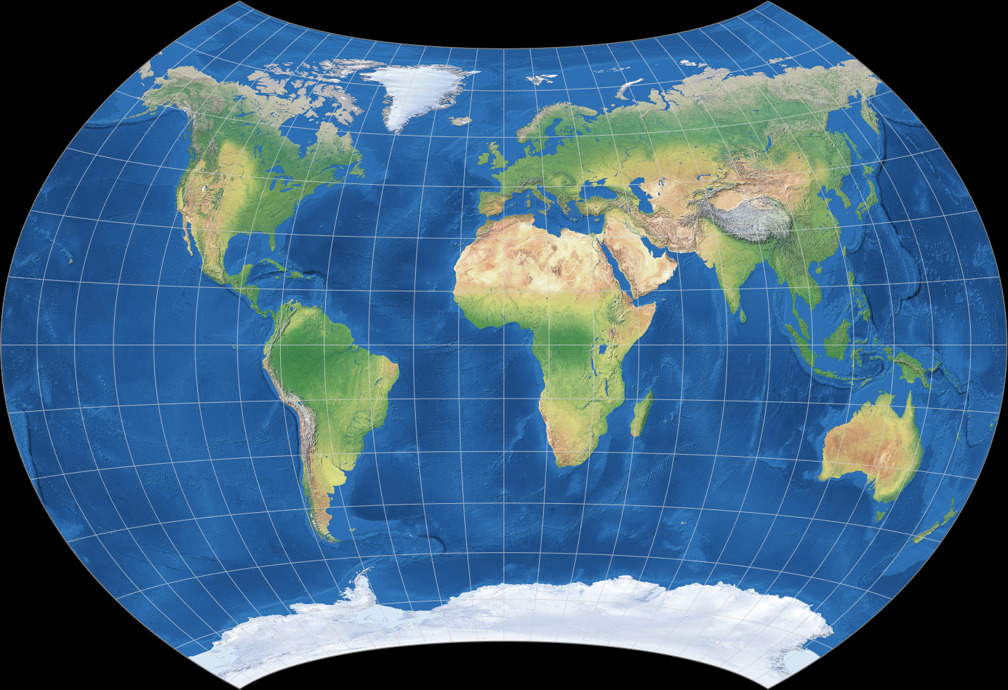
- Frančula stated that the projections were developed to be used as general reference maps in atlases, but pointed out that they also might serve well for thematic maps. Thus, they look more or less like all the maps we’re used to: World maps with a pole line, in equatorial aspect, without interruptions. Don’t expect anything unusual or surprising!
-
And last but not least:
Without the help from Peter Denner, I would not have been able to show you this projections. Based on my provisional implementation of the customizable Wagner IX he developed a final version that not only was generally improved but also offered the option to apply the Umbeziffern to other parent projections.
Thanks a lot, Peter!
The implementation for d3-geo-projections will be presented separately sometime soon.
After this opening speech we finally can look at the projections.
Frančula I – Frančula V
| Projection | EA | Parenting Projection | Variant of | |
|---|---|---|---|---|
| Frančula I Anlage 1 |
0.3087 | Sinuosidal | Wagner III |
|
| Frančula II Anlage 2 |
0.3115 | Apian II | Wagner VI |

|
| Frančula III Anlage 3 & 4 |
0.2797 | American Polyconic |
— |

|
| Frančula IV Anlage 5 & 6 |
0.2745 | Equidistant azimuthal |
Wagner IX |
|
| Frančula V ∗ Anlage 7 |
0.3172 | Equal-area azimuthal |
Wagner VII |
|
|
∗ equal-area Lower values of EA are better |
||||
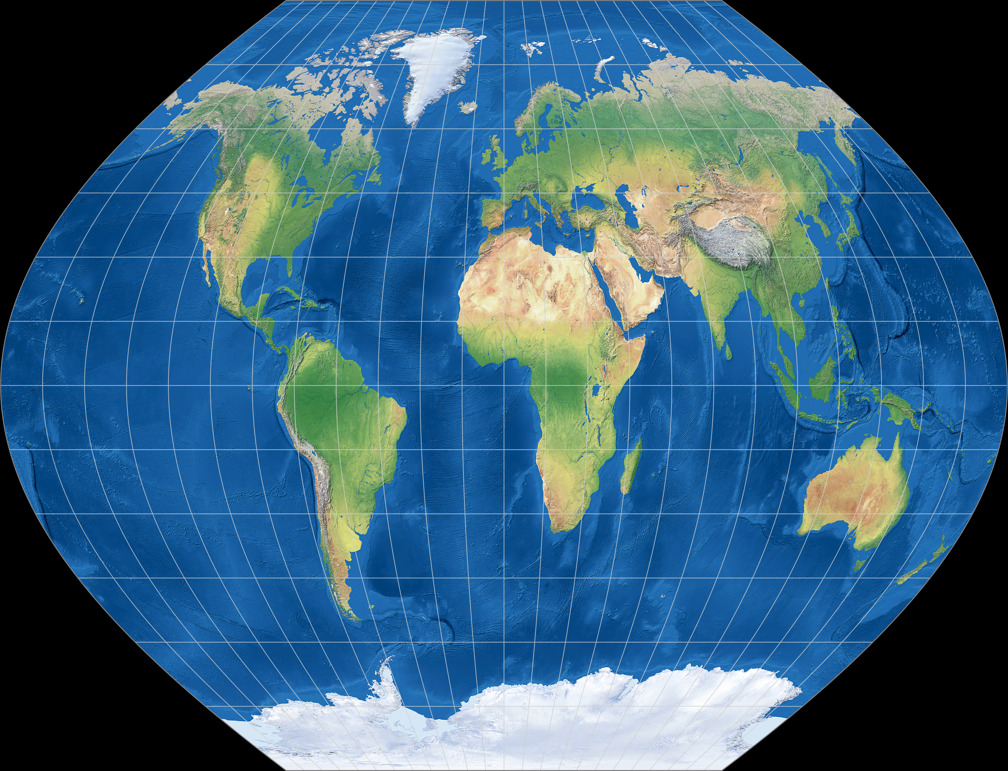
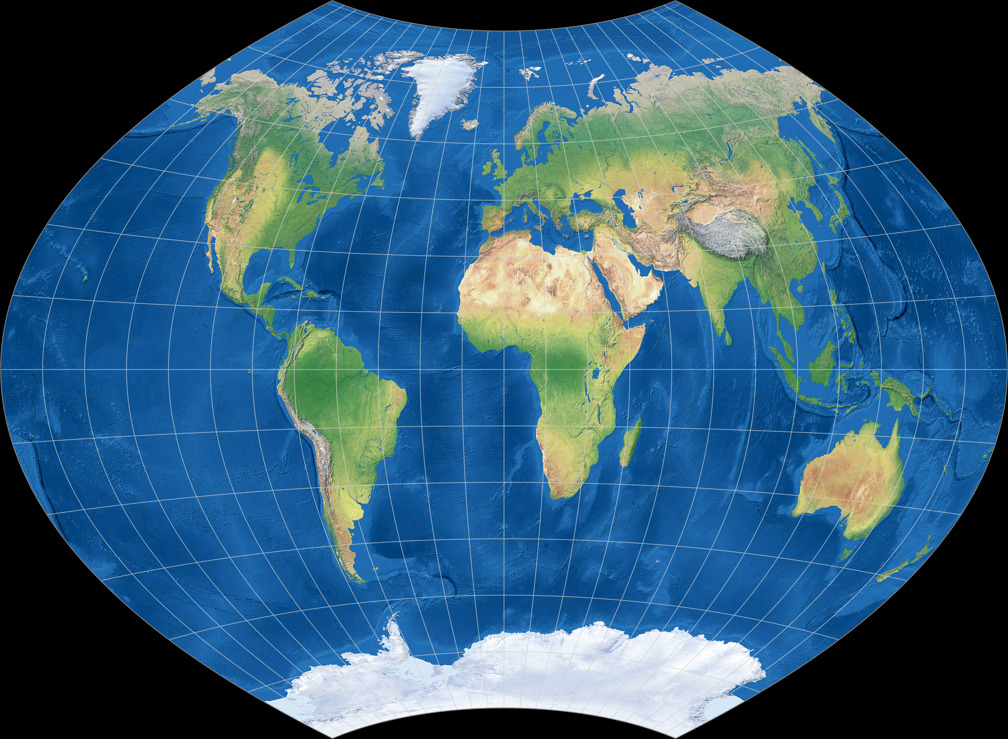
The projections Frančula I to Frančula V were optimized for minimal distortion according to the Airy criterion (EA); lower values indicate lower distortion and are better. I to IV have equally spaced parallels (along the central meridian) and belong to the type of aphylactic (compromise) projections, No. V is equal-area.
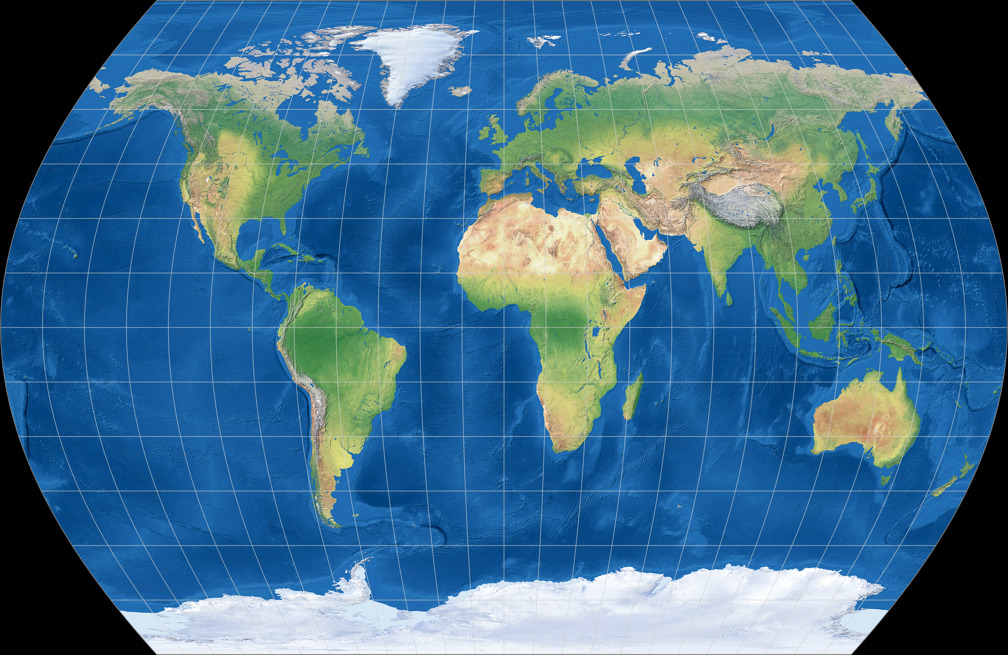
While pseudocylindric projections I and II do have low distortion values, they look (in my opinion) quite unpleasing to the eye because of the stretch in north-south-direction. I much prefer the lenticular projections III and IV, they also show better EA values. Since they are somewhat similar at first glance, here’s the link to compare them directly.
Frančula V shows the highest distortions values but has the often-useful property of equivalence. By the way, my own experiment I called Wagner BCW-E is somewhat similar (but I promise that I knew nothing about Frančula’s projections when I came up with it).
Frančula VI – Frančula IX
| Projection | EA | Parenting Projection | Variant of | |
|---|---|---|---|---|
| Frančula VI Anlage 9 & 10 |
0.3825 | Sinuosidal | Wagner III |

|
| Frančula VII Anlage 12 & 13 |
0.3830 | Apian II | Wagner VI |
|
| Frančula VIII Anlage 15 & 16 |
0.3303 | American Polyconic |
— |
|
| Frančula IX Anlage 18 & 19 |
0.3218 | American Polyconic |
— |

|
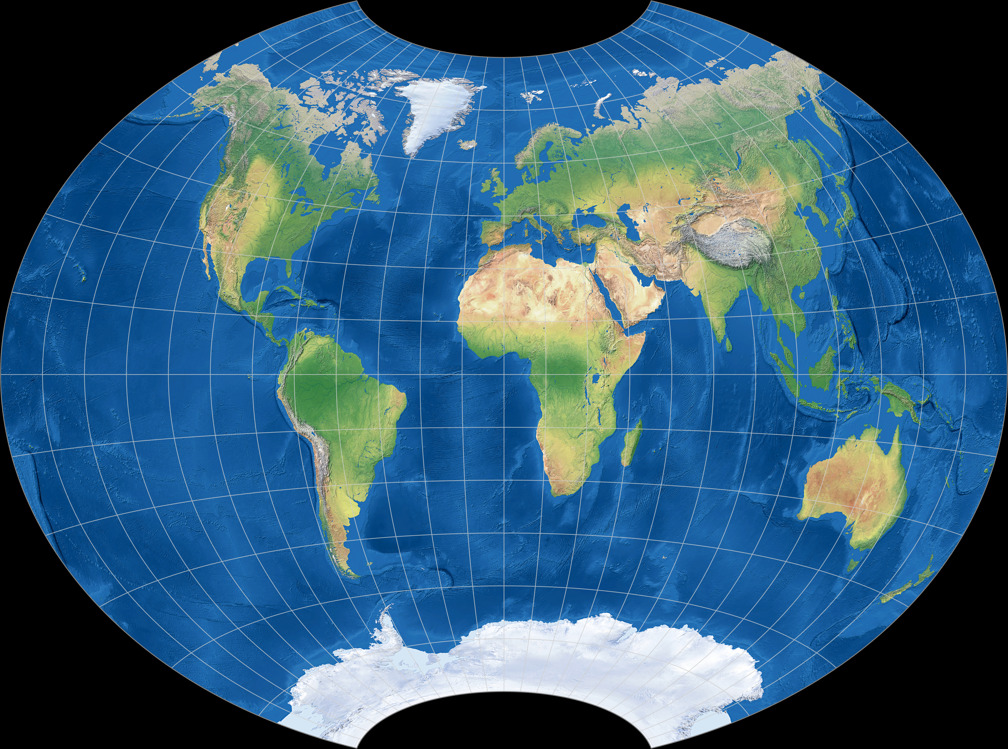
The projections VI to IX were developed using the Airy criterion, too. They are based on
parent projection, we’ve already seen on Frančula I to III.
How’s that?
Well, the first variants have a standard parallel (and thus, the area of lowest distortions)
around 60° North/South. This not only
explains their “stretched” appearance but also leads – despite their low overall distortion –
to an unfavorable distribution of distortions.
In order to fix this, Frančula set the standard parallel for the projections VI and VII to 40° North/South and adjusted the length of the pole line in order to reach minimum values of EA in this configuration. The result indeed looks better to me, and probably fits better to the intended usage as general-references maps.
So far, so good. On the other hand, the variations of Francula III, i.e. Frančula VIII and IX, make me frown.
The idea was the same, namely to enhance the distribution of distortions. But…
Firstly, they look less attractive to me than No. III. Well, that’s an objective, purely aethetic judgement, so scratch that.
Secondly, I’m not so sure whether the distribution of distortions is actually better.
It’s true, the areal distortions in regards of the nominal(!) scale of the map seem more balanced,
but I think the distribution of angular distortions is even a bit worse.
But more importantly I don’t understand why the Frančula VIII is listed at all,
when IX looks almost identical but has a lower EA value.
I just would have discarded the VIII…
Well, I don’t know the reason, and if it’s mentioned in the paper, I managed to
read over it so far. However:
Compare Frančula VIII and IX
– you’ve got to look closely to see the differences.
To inspect the changes applied to the first rendition:
Compare Frančula III and IX.
Before me move on to the next section, here’s a table of all the Frančula projection we’ve had so far and a few other well-known projections, sorted by their EA value, best to worst. All values were copied from Frančula’s paper.
| Projection | EA |
|---|---|
| Frančula IV | 0.2745 |
| Frančula III | 0.2797 |
| Frančula I | 0.3087 |
| Frančula II | 0.3115 |
| Frančula V ∗ | 0.3172 |
| Frančula IX | 0.3218 |
| Winkel Tripel (Orig.) | 0.3280 |
| Frančula VIII | 0.3303 |
| Winkel Tripel Bartholomew | 0.3674 |
| Frančula VI | 0.3825 |
| Frančula VII | 0.3830 |
| Eckert V | 0.4012 |
| Eckert VI | 0.4025 |
| Eckert IV ∗ | 0.4068 |
| Kavraiskiy VII | 0.4126 |
| Mollweide ∗ | 0.4419 |
| Hammer ∗ | 0.4654 |
| Aitoff | 0.5041 |
| Sinusoidal ∗ | 0.5581 |
|
∗ equal-area Lower values of EA are better |
|
Frančula X – Frančula XIV
| Projection | EAK | Parenting Projection | Variant of | |
|---|---|---|---|---|
| Frančula X | 0.2498 | Sinuosidal | Wagner III |
|
| Frančula XI Anlage 21 |
0.2490 | Apian II | Wagner VI |
|
| Frančula XII Anlage 22 & 23 |
0.2388 | American Polyconic |
— |
|
| Frančula XIII Anlage 25 & 26 |
0.2359 | Equidistant azimuthal |
Wagner IX |
|
| Frančula XIV ∗ Anlage 28 |
0.3177 | Equal-area azimuthal |
Wagner VII |
|
|
∗ equal-area Lower values of EA are better |
||||
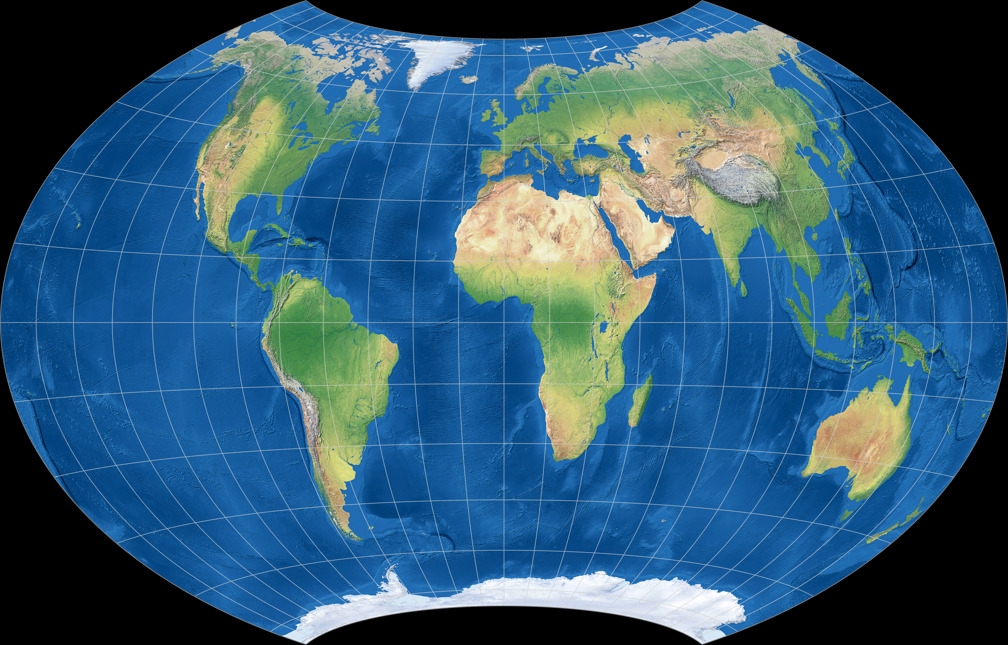
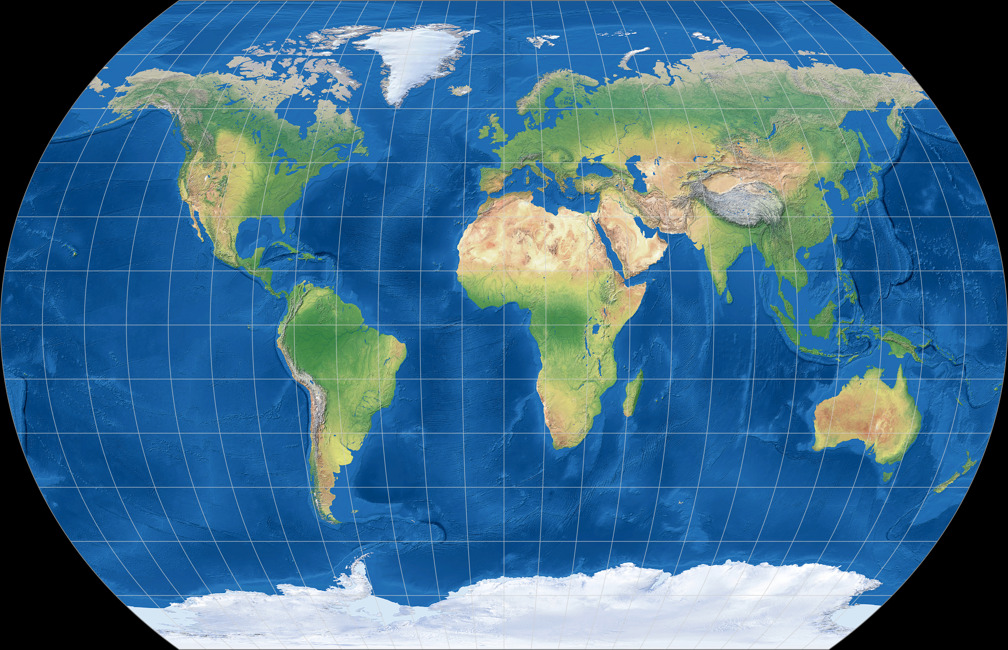
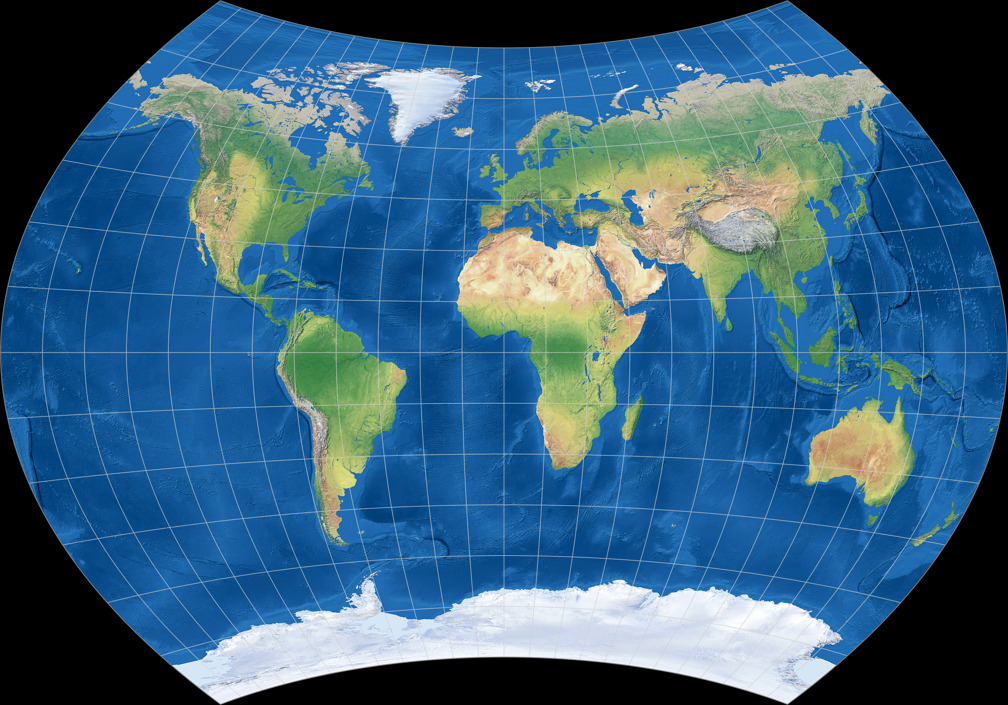
The final five projections are derived from the same parents as before but were optimized for low distortion values according to the Airy-Kavrayskiy criterion. In my opinion, the pseudocylindricals (X and XI) look much better than their Airy criterion counterparts. It’s harder for me to decide on the lenticulars: They look different of course but both the Airy and the Airy-Kavrayskiy variants are quite pleasant.
Although derived from different parent projections, Frančula XII and XIII look somewhat similar.
Compare them directly to spot the differences.
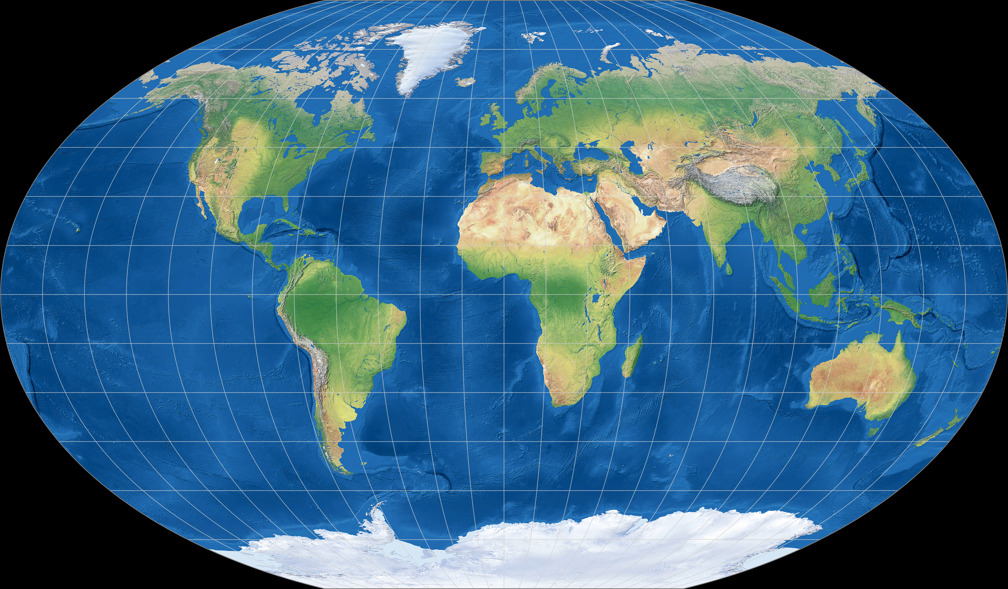
And again, the equal-area projection (XIV) has the highest distortion values but they still are
quite good. Apart from its more pronounced North-South stretch, it’s very similar to
a variant Wagner himself introduced in 1941[4] which I have
labelled Wagner VII.d:
Compare Wagner VII.d and Frančula XIV.
And here’s the table of the EAK values of Frančula X to Frančula XIV, compared to the same well-known projections as before, plus Robinson and Eckert III: [5]:
| Projection | EAK |
|---|---|
| Frančula XIII | 0.2359 |
| Frančula XII | 0.2388 |
| Frančula XI | 0.2490 |
| Frančula X | 0.2498 |
| Winkel Tripel (Orig.) | 0.2597 |
| Winkel Tripel Bartholomew | 0.2603 |
| Kavraiskiy VII | 0.2614 |
| Robinson | 0.2778 |
| Eckert III | 0.2853 |
| Eckert V | 0.2972 |
| Frančula XIV ∗ | 0.3177 |
| Eckert IV ∗ | 0.3326 |
| Eckert VI | 0.3496 |
| Aitoff | 0.3690 |
| Mollweide ∗ | 0.3774 |
| Hammer ∗ | 0.4096 |
| Sinusoidal ∗ | 0.4701 |
|
∗ equal-area Lower values of EAK are better |
|
A few Words on Distortions
While I was writing this blogpost, it was pointed out to me that
“unlike the Airy-Kavrayskiy criterion, the Airy criterion gives different results
for horizontal compression / vertical stretching than for
horizontal stretching / vertical compression by the same factor”.
Which is why Frančula I to V, VIII and IX all seem vertically stretched (or horizontally compressed),
especially the first two. (VI and VII are exceptions here because Frančula deliberately deviated
from the principle of achieving the lowest possible value of EA.)
Just mentioning that because it explains a lot.
As I’ve said in the beginning, currently I can show the usual visualization of distortions only for two projections, namely Frančula V and XIV. Since both are equivalent, there are only angular distortions. For comparison, I add the original Wagner VII.
Lighter hues mean less distortion. Darker hues mean more distortion.
The red lines mark the maximum angular distortion of 40° and 80°.


Well, it’s always the same when you change parameters of a projection: Some areas win, others loose;
and it’s hard to say which variation is the best in total (basically, that’s why people came up
with such metrics as the Airy and Airy-Kavrayskiy criteria).
So I’ll just say that regarding the distribution of distortions I think all three of them
are appropriate for atlas cartography.
UPDATE Nov 6, 2021: Visualizations of Distortions
Above I said that I could show the usual visualization of distortions only for two projections. Thanks to Peter Denner, I now can present according images of all 14 Frančula projections! 🙂
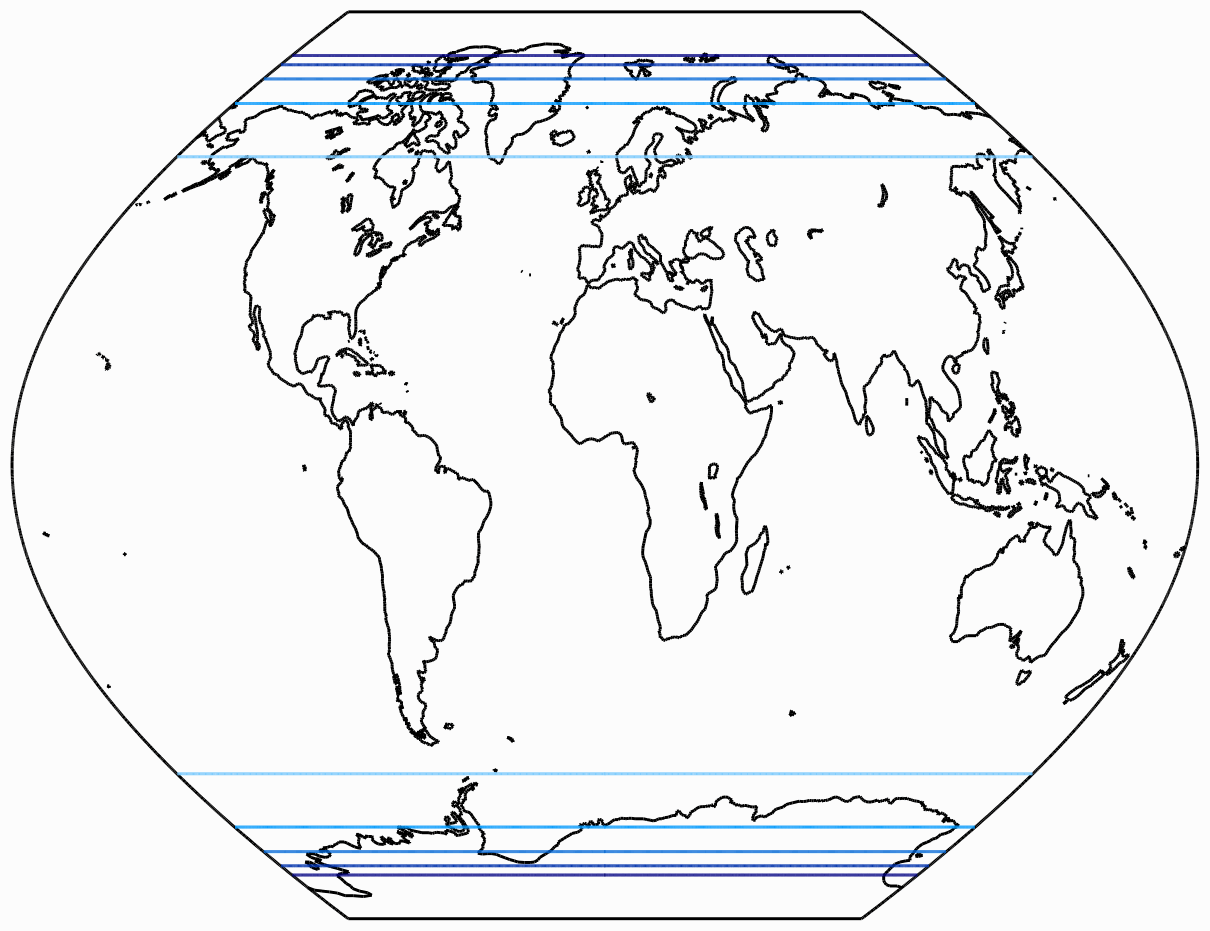
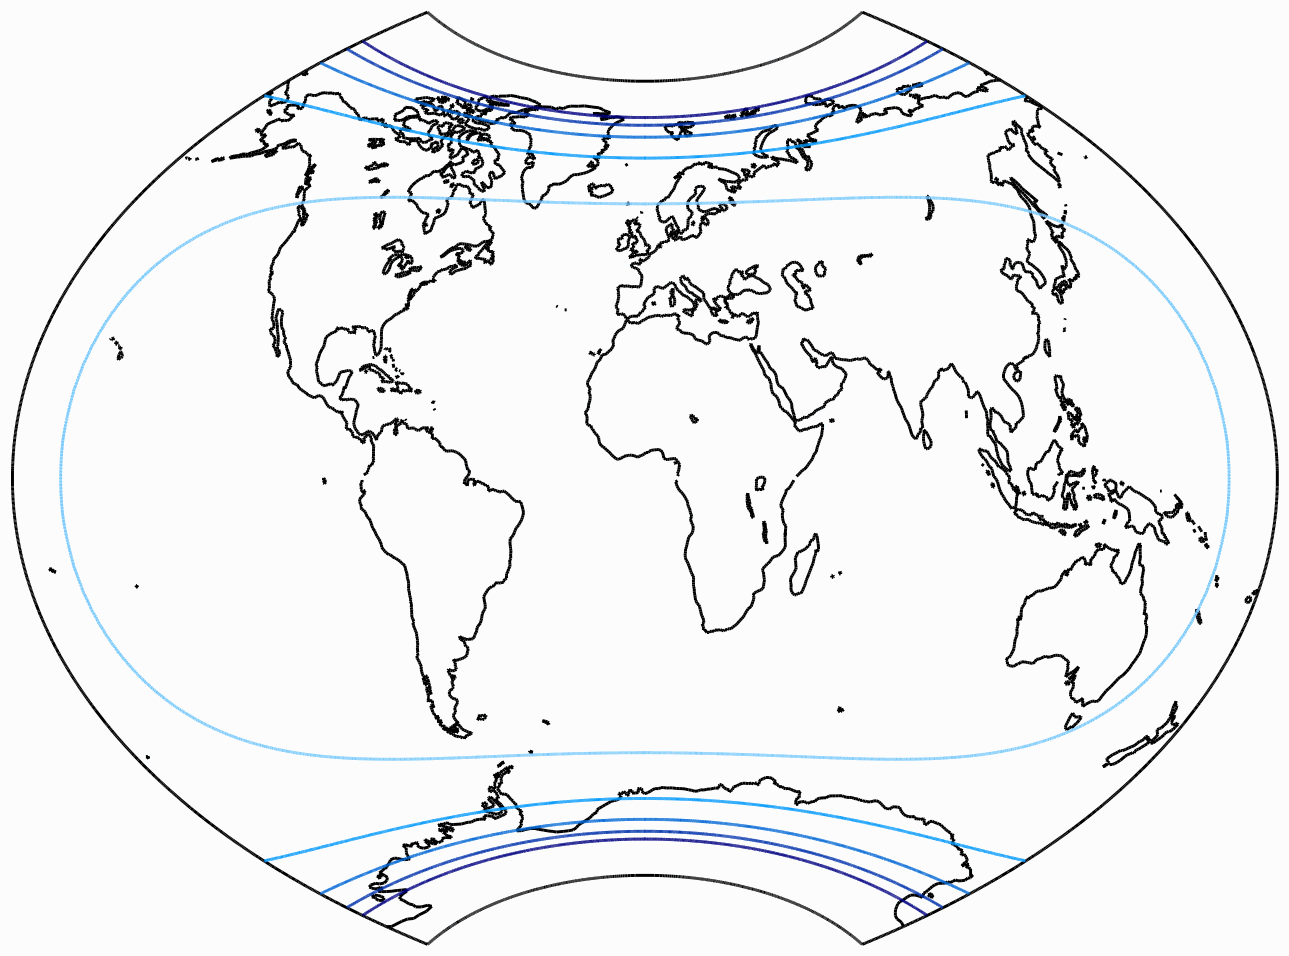
Isolines of Angular Distortions
Again, here are distortion visualizations provided by Peter Denner.
The isolines are given for max. angular deformation of:
10°,
20°,
30°,
40°,
50°,
and 60°.


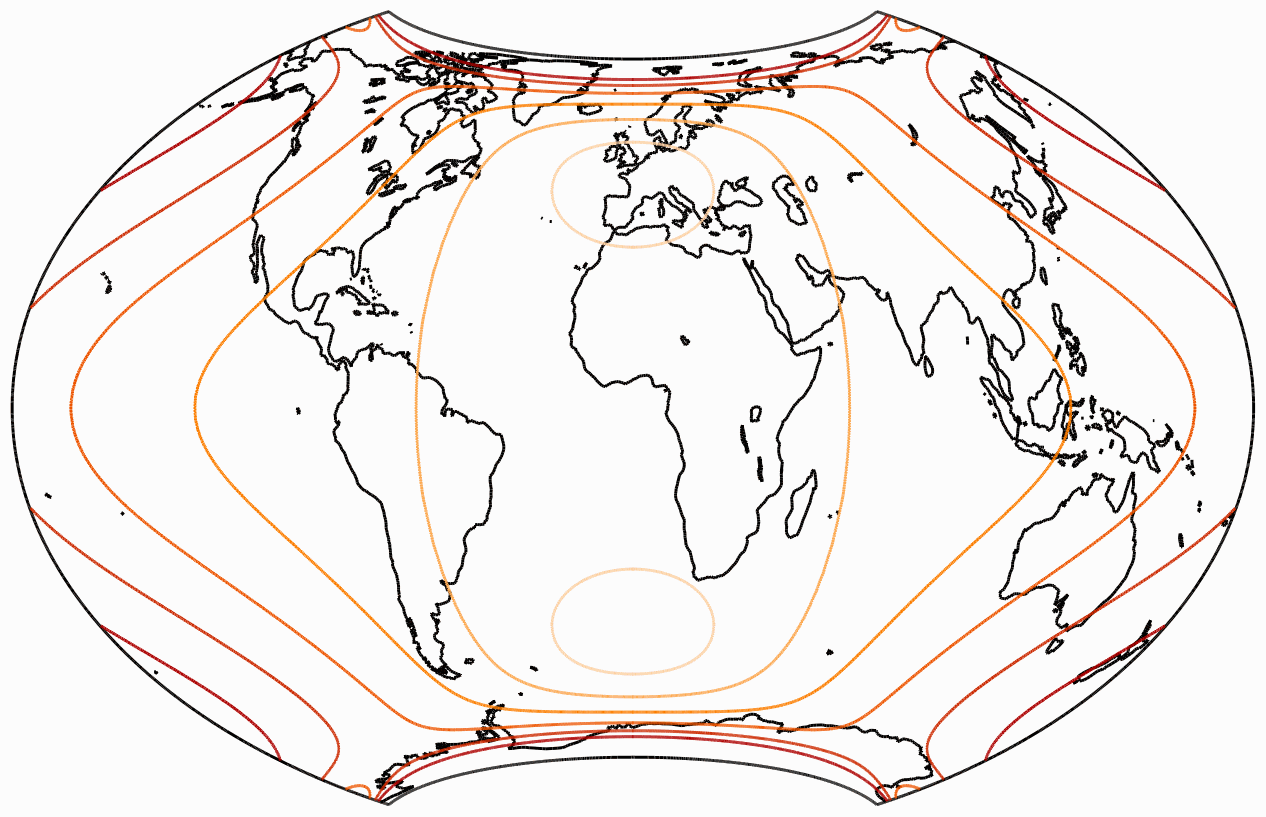


Isolines of Areal Inflation
Of course we skip the equivalent projections Frančula V and XIV. Please note that the lines are normalized to the value at the central point of the map! Mostly, they are given relative to the nominal scale of the map. They are shown at areal inflation values of:
1.5;
2.0;
2.5;
3.0;
and 3.5.


Résumé
Frančula introduced 14 projections with low distortion values.
Do they fulfil the claim of being “advantageous projections for atlas cartography”?
Here’s my personal opinion:
Frančula I and II: Well, they might be useful if you really feel the need to cram a pseudocylindric projections into a tight space. I probably would not recommend them for general reference maps but maybe for one or the other thematic map. Although I have to say that in this case, I don’t see any advantages over known projections (e.g. Wagner III with corresponding standard parallels).
Frančula III and IV, VIII and IX: There’s still quite a vertical stretch, but aesthetically speaking, I like them nonetheless. I think they are suitable for atlas cartography if you want to save some space horizontally. However in the atlases I know there’s no need to save space in this direction. Therefore, I’d rather use them for thematic maps (usually displayed smaller) than for the main maps (which tend to be given a lot of space). In addition, they should also be suitable for general reference wall maps where aesthetic considerations might be more important than in an atlas.
Frančula VI and VII, X to XIII: Now we’re talking. I think they are very usable for general reference maps, both in atlases and on wall maps. I prefer the series that was optimized according to the Airy-Kavrayskiy criterion and among them, the lenticular projections.
The equal-area projections Frančula V and XIV: Both are suitable for the cause. Each has its own pros and cons, all in all I prefer No. XIV.
Résumé of the résumé: Except for Frančula I and II, I think all projections are
suitable for atlas cartography. Some more than others, in terms of the usual
layout of atlases I know. But even those “others” might prove valuable in
certain situations.
In any case, they are interesting alternatives to the “usual suspects” like
Robinson, Winkel Tripel etc.
Györffy’s Comment Regarding the Shape
In the beginning I said that my attention was drawn to the Frančula projections when I read Györffy’s paper. What he actually said about them was this:
(…) some projections were created representing the poles as concave curves (bent towards the equator) by suitable renumbering of Aitoff and ordinary polyconic, with even lower EK values (…) They are ignored in the praxis of cartography because of their appearance.
(…)
The shape of the mapped Earth in the renumbered Aitoff and ordinary polyconic (…) suggest that a minimized distortion projection, representing the pole as a line, generates an outline with concave pole lines (…) The unfamiliar shape of the mapped Earth provokes the neglect of these projections.
Apparently it’s true that the Frančula projections so far have been “ignored in the praxis of cartography” (at least I don’t think that I have ever seen them anywhere), but I do not agree with the reason he’s giving for this. Their appearance merely is one of the possible reasons – but in my opinion there’s no evidence that it’s the actual reason. I think it’s just as likely that the Frančula projections rarely have been used because only very few people actually know about them.
However, if you basically like e.g. the Frančula XIII but hate the concave poles lines … just cut off the polar areas:
You might argue that such a truncation is a bad practice, and I tend to agree (even disregarding the fact that I like concave pole lines anyway). However I have seen worse truncations in atlases and on wall maps. And even disliking the practice, I have to admit that you don’t cut off anything that is really important to have on a general reference world map. Below are the parts that were removed – I guess that’s an acceptable loss.

And an Experiment
Just out of curiosity, I used the Umbeziffern to create a projection that has some similarity with the Frančula XIII – more or less the same length and curvature of the pole line and the bounding meridians –, but uses the equal-area azimuthal projection as parent, with “controlled areal inflation” (as Wagner called it), which makes it a variant of Wagner VII/VIII instead of Wagner IX. I chose a configuration that results in a smaller amount of areal inflation than the Frančula XIII has.
I liked the result, but at first I wasn’t sure if I should add it to the website… but then, I realized something: Using Richard Capek’s distortion characterization Q[6] (another one of these metrics to measure overall distortion in a map projection), my experiment ended up with Q value of 88.1 – which is excellent, more accurately: Better than any of the 100 (uninterrupted) projections that were listed in Capek’s paper!
Granted, the Q for my projection was not calculated from the
projections’ formula but determined by a certain way of cartometry
(about which I’m going to write a long and tiresome blogpost sometime soon);
and the Q has certain deficits (I’ll elaborate on this in the afforementioned blogpost);
and of course there may be projections not surveyed by Capek which have an even better
Q value…
… But, hey, it was a nice surprise anyway! 😊
So here it is, my… wait, what do I call it?
It’s inspired by the Frančula XIII so there should be some relation to that name.
It’s surely no approximation because the distribution of meridians and parallels differs
quite a bit.
Ah, well… I’ll just call it the F13 Copycat.
This time, I use a different visualization of distortions, namely isolines of areal and maximum angular distortion, which makes it easier to compare to the images of the Frančula XIII given on page 86, Anlage 25 and 26, in Frančula’s paper.


You will notice that the isoline indicate an areal inflation by 3.0 runs along 80° North/South,
very much like it does on the Frančula XIII. So why am I saying that the Copycat
has “a smaller amount of areal inflation”?
Note that at the center of the map, the areal inflation is given as 0.77 (so it’s an deflation)
on the Frančula XIII while it’s 1.0 (= equal-area along the equator) on the copycat, so the latter actually has less areal inflation.
Or, more precisely, a smaller variance of areal distortions.
Regarding the angular distortions, Frančula’s original clearly shows a better distribution, but this was to be expected.
Using the Böhm notation, the F13 Copycat is called vii@60-77-60-45-170.
To render the projection in Geocart,
use the generalized Wagner with the parameters:
a  = 2.148298
b  = 1.573349
m  = 0.953264
m2 = 0.725519
n  = 0.427778
or use the d3-geo-projection scripts with:
            d3.geoWagner()
.poleline(60)
.parallels(77)
.inflation(45)
.ratio(170)
Footnotes
-
↑
János Györffy: Minimum distortion pointed-polar projections for world maps by applying graticule transformation
doi.org/10.1080/23729333.2018.1455263 -
↑
Wagner’s Umbeziffern and the Böhm notation:
map-projections.net/wagner-umbeziffern.php - ↑ Nedjeljko Frančula: Die vorteilhaftesten Abbildungen in der Atlaskartographie (German)
-
↑
Wagner, Karlheinz:
Neue ökumenische Netzentwürfe für die kartographische Praxis.
In: E. Lehmann, ed., Jahrbuch der Kartographie 1941.
Leipzig: Bibliographisches Institut. 176–202. - ↑ Die EAK for Robinson and Eckert III are not taken from Frančula’s but from Györffy’s paper. Note that Györffy calculates his EK differently but the values can be converted to each other by dividing Györffy‘s EK by the square root of 2 – or vice versa, by multiplying Frančula’s EAK with √2.
-
↑
Capek, Richard 2001:
Which is the Best Projection for the World Map?
icaci.org/files/documents/ICC_proceedings/ICC2001/icc2001/file/f24014.pdf
Comments
Due to spam posts, comments are now subject to moderation, which means they remain hidden until they are approved by a moderator.
One comment
Miljenko Lapaine
Thank you very much for presenting Prof. Frančula's map projections. I would like to publish you interesting comments and remarks, as well as Frančula's maps in the Cartography and Geoinformation journal. The journal is published twice a year in Croatian and English by the Croatian Cartographic Society (kig.kartografija.hr). Do you agree?
Just one small remark from my side: his name is Nedjeljko, not Nedjelko.
Best regards,
Miljenko
*****************
Prof. Emer. Miljenko Lapaine
University of Zagreb, Faculty of Geodesy
Croatian Cartographic Society, President
ICA Commission on Map Projections, Vice-Chair
mlapaine@geof.hr
 Except where otherwise noted, images on this site are licensed under
Tobias Jung
permission to publish my comments and remarks is granted! :-)
And thanks for pointing out the wrong spelling of Mr. Frančula’s first name! I just corrected the blog post, the database entries of the projection list will be updated soo, too.
Kind regards,
Tobias