
Fri Jan 04, 2019 New: Four Polyhedral Projections
3 updates, last on Mon Apr 28, 2025
I’ve got to admit it: For a long time, I treated the polyhedral projections as an orphan. The main reason was that I had no application to render images for this kind of projections. Thanks to Justin Kunimune’s MapDesignerRaster this had changed so let’s right that wrong and look at four of them!
Kunimune’s Mutated AuthaGraph Offspring
I already mentioned the first projection
in another blogpost, but now it has also been added to the list on my website.
I’m talking about Justin Kunimune’s recreation of the AuthaGraph World Map.
In Kunimune’s text Reverse Engineering the AuthaGraph, look at the image in which he compares
the original with his own version: You’ll see substantial differences, most notably at South America’s east coast.
But actually, the differences iron out the flaw that bugs me most in the original: The size difference of Russia and China. In reality, Russia is about 1.7 times larger than China, but in the original AuthaGraph map grows it onto roughly 3.4 times of China’s size. Yes, that’s an extreme example: It’s reasonable to assume that the areal distortions behave much like the angular distortions of the van Leeuwen projection, i.e. there’s a considerable amount of distortion almost everywhere, but the range of distortion values is much smaller than in other projections. Now, most of China apparently ends up in parts of the map which deflate the areas, while large parts of Russia end up in parts that inflate the areas. Ultimately, this leads to the significant difference of the ratio, which is why I think you can’t say that the AuthaGraph is »close to equivalence«.
Kunimune’s variant is more moderate in this respect: Here, Russia occupies about 2.7 times the area of China.
Still a remarkable deviation from equivalence, but also clearly closer to the actual ratio.
This does not necessarily mean that it is also closer to true equivalence overall
(when calculating an average value of areal distortion) – but it means something else,
namely that in my opinion it deviates too far from the original to call it an approximation.
So, how do I call it?
After thinking a while, I came up with Kunimune’s Mutated AuthaGraph Offspring or
Kunimunes MAGO for short. It has a ring to it – being a long- time fan of the X-Men comic book, I like Mutants,
and hey, it even has a superpower: It straightens out the flaw in areal relationships I mentioned above! ;-)
Mostly, the AuthaGraph is shown with Africa being at the left edge of the map, but this isn’t mandatory –
on the contrary, it’s pointed out as an advantage that you can cut any section you want from the tessellated version
(see this illustration).
For the benefit of a better comparison to other projections, I decided to add a variant with America on the left side to my website.
But for the sake of completeness, here’s also Kunimune’s MAGO showing Africa left.


P.S.: I’d like to point out again that I can’t add the original AuthaGraph map to my website. Narukawa didn’t publish the formulae so no map projection software knows how to render it.
Alright, after the AuthaGraph offspring, here’s not one, not two, but three projections that were inspired by Bernard J.S. Cahill’s butterfly map.
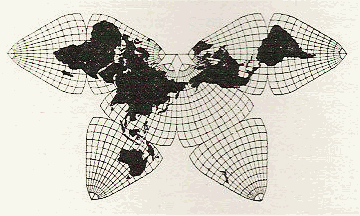
Cahill’s Map
Public Domain, part of The Butterfly Map
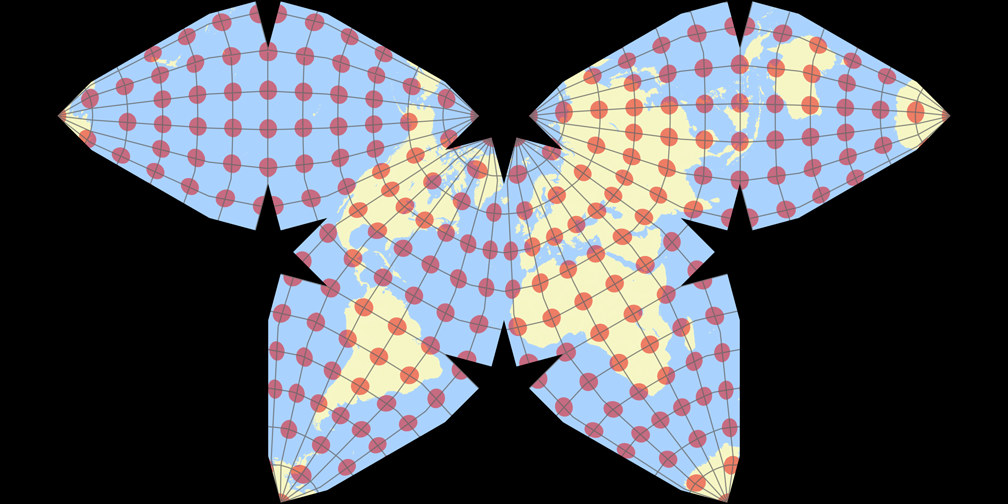
Waterman Butterfly Map
In 1996, Steve Waterman published a world map that was generated by unfolding a »globe« which is treated as a truncated octahedron. The result is, aesthetically speaking, very attractive, but it also has remarkably low distortions (see below). However, I probably wouldn’t use it for an general reference map but only for decorative maps. But maybe I’m just too conservative here?

On this website, I call it Waterman Butterfly (alternative arrangement), because the usual configuration
which is preferred by the creator is different:
Antarctica gets cut off the tips and is reassembled as an »island« below the rest of the projection. Regrettably,
the software I’m using doesn’t offer this arrangement, but it can be achieved but doing a bit of copy & paste
on the rendered image. The genuine disposition looks like this:
… usually, however, the work is done cleaner than I did it, which is why I’m showing this small rendition only. Scaling down images is a great way to conceal that you’ve messed up things! ;-)
By the way, Waterman came up with his design while working on close-packing of spheres. You’ll find more information
regarding this matter here:
– Sphere packing on Wikipedia;
– Waterman polyhedron on Wikipedia;
– Steve Waterman’s own website (englisch);
– which also contains, quite hidden, the projection method of the Butterfly map.
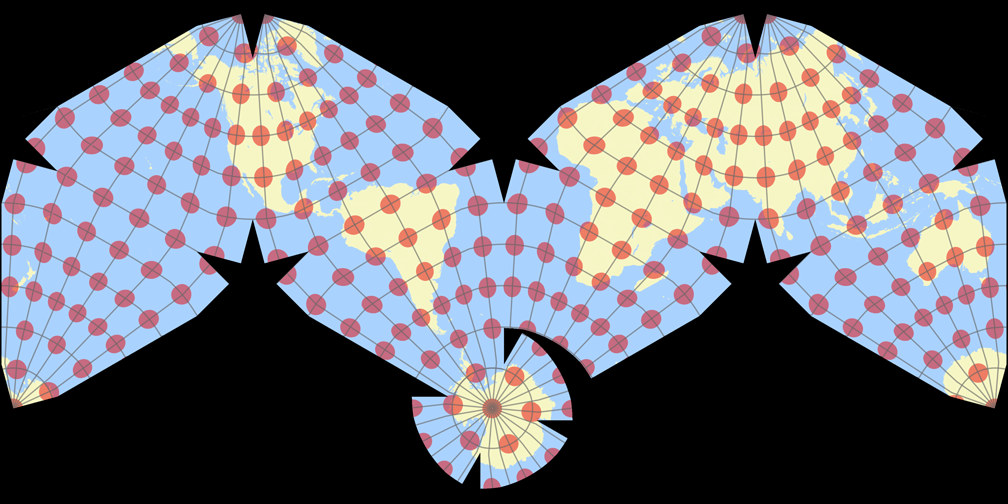
Cahill-Keyes Projection
Gene Keyes began developing his projection in 1975 and also referred to Cahill – that’s why he called it the Cahill-Keyes projection. His idea was to transform the butterfly shape to an M-shape. Later he found out that Cahill himself already had designed some variations using this shape. You can find more about this, and a lot of detailed information about Cahill’s and Keyes’ maps on Gene Keyes’ own website.

At first glance, you might think that Waterman’s and Keyes’ projections are identical if you cut apart the »lobes« or »wings« (or whatever you like to call it) and put them back together M-shaped – but actually, the distribution of distortions is different within the lobes – we’ll see that later.
For a general reference map, I’d prefer Keyes’ M-shape over Waterman’s butterfly, but that of course is just my own opinion. (And frankly, I’d probably choose neither in the end.) Apart from that, in comparison to the Waterman projection I prefer the idea that Antarctica is still connected to the rest of the world, but on the other hand, I’m not that fond of the fact that some parts of Antarctica are shown twice.
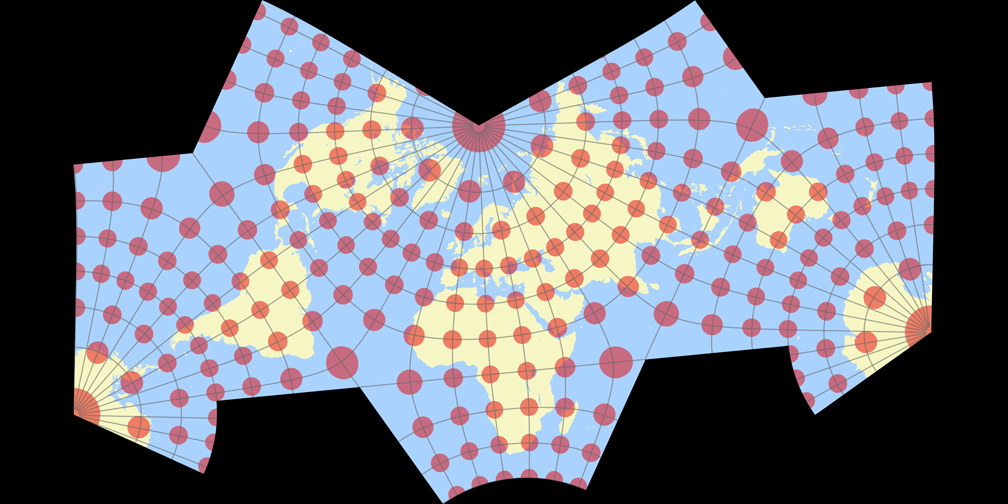
Cahill-Concialdi Bat Projection
Luca Concialdi posted his Cahill-Concialdi Bat Projection in September 2015 in
the forum of mapthematics.com and almost a year later again
in the cartotalk.com forum – which regrettably has been shut down
and switched to »read only mode« is not available anymore :-(
(The posting, albeit without the presented image, can still be read
in the Web archive.)
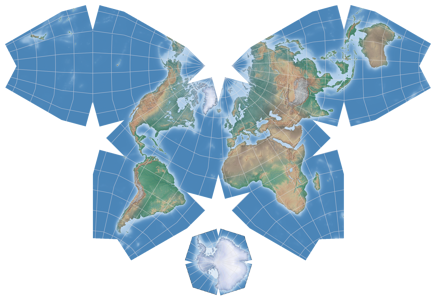
Unlike the other two, it’s not a compromise but a conformal projection.
Concialdi developed the projection working graphically (yes, you can get along without mathematical formulae, and it’s not the first example of that kind in the history of map projections), Justin Kunimune figured out the mathematics so now there’s a software to generate projection images like this:

Image by Luca Concialdi & Tobias Jung,
CC BY-SA 4.0
Aesthetically it’s a magnificent variant, but it also has remarkable features regarding
the areal distortions (see below).
But first, let me quote from my personal communication with Luca Concialdi (with Luca’s permission, of course), where he stated
his main goals:
- The northern hemisphere must be united with no interruptions at all. As the biggest part of the continents are located in the northern hemisphere you should be able to virtually walk from Japan to Canada, passing through Russia, Scandinavia and Greenland without getting out of the map.
- The only unavoidable interruption of the northern hemisphere must be the 170° east meridian. That meridian passes through Bering Strait, so Russia will remain practically uninterrupted.
- New Zealand must be on the same map portions of Australia, as in almost all world maps.
Unfortunately, one land remains torn in two: Antarctica. I decided to keep this land split in two parts for two reasons: Firstly, to maintain the overall symmetry of the map; secondly, this land is exactly over one of the non-conformal points. This means that if you join the two parts (you can take two maps and place them side by side) you’ll see the big flaw: Antarctica loses its »round« shape and it’s quite bigger than it has to be.
Note: It’s not unusual that conformal maps have certain points where conformality fails. Actually this holds true for almost any conformal projection available.
The following section is no longer applicable, as of version 3 the software renders the projection as intended by Concialdi.
I’d like to point out that Kunimune implemented a slightly modified arrangement, which achieves a higher symmetry but also collides with Concialdi’s main goals – in Kunimune’s defence, he probably didn’t know the goals at that time. This is the configuration that is rendered by the software:

Fortunately you can build Concialdi’s arrangement from the exported image by doing some copy & paste
as shown the the schematic below: Cut out the darker parts of the map and move them to position of the brighter parts.
In the end, rotate the full map by 5.5° counterclockwise to align the upper tips.

A bit of a problem in doing this is that you can’t cut along a straight line since the
appropriate meridians are slightly curved. Probably I’d have added the Cahill-Concialdi projection
to my website using the arrangement that is exported from the software, but Luca Concialdi was
nice enough to do the copy & paste work for me.
Thanks a lot, Luca!
Update: The current version 3.3 of the map projection software Geocart includes the Cahill-Concialdi projection using Concialdi’s arrangement.
Distortions
Before evaluating the distortions of the four projections, a few notes.
- The images were rendered by Justin Kunimune’s MapAnalyzer which also is available at GitHub.
-
In the images, the shades of grey indicate angular distortion (that’s why the conformal Cahill-Concialdi has no grey at all).
Shades of red and blue indicate areal distortion, with red being deflation and blue being inflation. An equal-area projection
would have no reds and blues at all but today, we’ve got no projection of that kind.
Darker areas indicate a higher distortion of the respective kind. - And of course, the images are somewhat generalized. This means that a white area doesn’t mean »no distortion at all«, but rather »no or very low distortion«.
Let’s start again with Kunimune’s Mutated AuthaGraph Offspring:

As I suspected, the distribution of angular distortions is not unlike those that can be found in the van Leeuwen projection (which, being equal-area, has no areal distortions). Regarding the areal distortions of the MAGO you can see that the highest values are being kept away from most of the landmasses.
Before we move on to Waterman and Cahill-Keyes, I’d like to show the distortion visualization of some compromise projections that are used very often (e.g. for wall maps): Winkel Tripel, Robinson, Miller and van der Grinten.
Notes: For reasons that are too complicated to explain them now, the visualization for Milelr and van der Grinten was rendered using a different application (Geocart), that’s why the look slightly different. Moreover, the angular distortions of Miller are displayed using shades of ocher instead of grey.


Now, compare these to the distortion visualization of Waterman and Cahill-Keyes – this illustrates the benefits of using a polyhedral projection: Both angular and areal distortions don’t get up as high as in a compromise projection of the usual (i.e. uninterrupted) kind:


You can also see that, despite their superficial similarity of the single lobes, there actually are certain differences. On the other hand, in my opinion you can’t say that one of them is »better«. So if you want to use a polyhedral projection for one of your projects, you’ll be fine with either. Just choose the one whose shape you prefer.
Now let’s get to the Cahill-Concialdi Bat Projection:
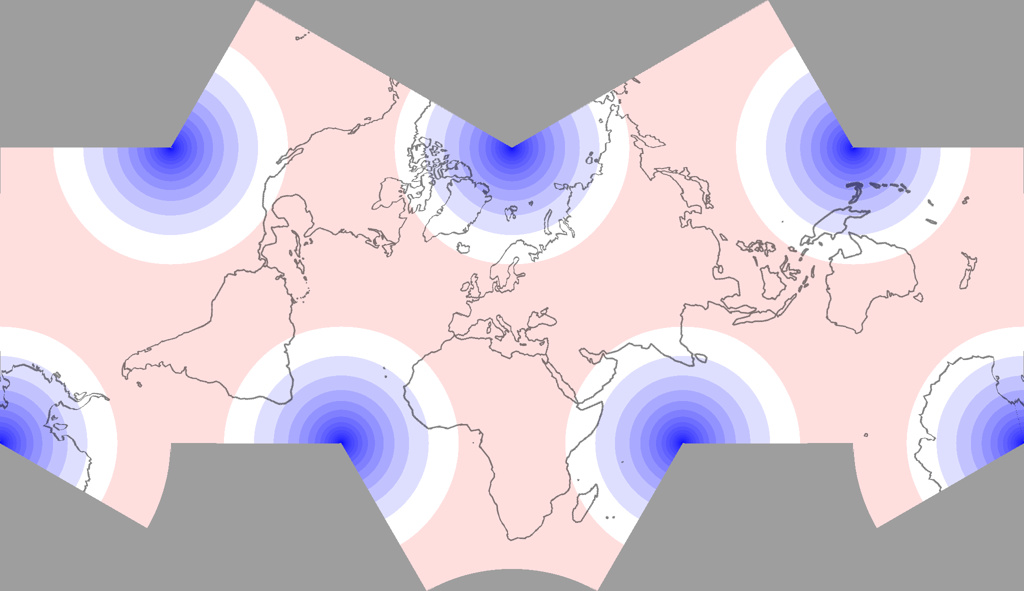
Conformal projections always have to struggle with heavy areal distortions, that’s unavoidable.
But can you see how the Cahill-Concialdi beautifully keeps the worst distortions away from the continents (except Antarctica)?
An aesthetically attractive conformal projection with comparatively low distortions –
I really like that, and I’ve got say that it promptly replaced my previous favorite of conformal projections,
the Guyou, from pole position.
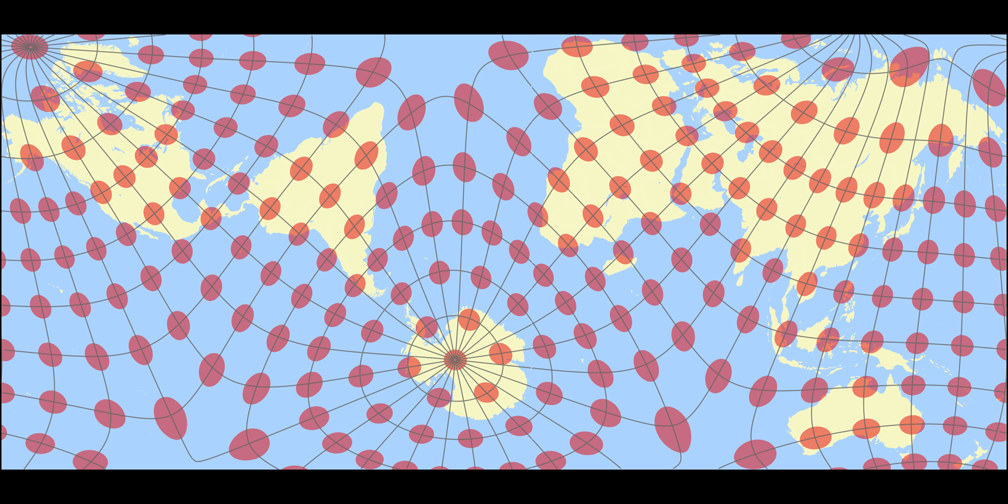
Finally, let’s have a look at the Tissot Indicatrix of the four projections:
In this regard: Another update on my website
On map-projections.net in the Single View and
the Compare via Thumbnail selection, you’ll find
a filter box which lets you reduce the full list by selecting certain types of projections.
Now, the type of polyhedral projections has been added to the filters.
But the filter for interrupted projections has been removed.
As I pointed out from the beginning, they are no type of projections anyway, but belong to
one of the other types (most of them, to the pseudocylindricals). While I had reasons for this classification,
it was probably ill-advised.
The interrupted projections are now filed under their genuine type.
Alright, that was the first update of 2019.
Happy new year!
Comments
Due to spam posts, comments are now subject to moderation, which means they remain hidden until they are approved by a moderator.
5 comments
Anthony
CG
I stumbled onto this site while attempting to research some polyhedral projection schemes for a personal project, and I'm quite fond of the look of that Cahill-Concialdi octahedral projection.
I'm wondering though if you know what projection is actually used to map the surface to each "pane" or polyhedral face, though?
My first guess would be something like a Gnomonic projection, but that doesn't seem to be the case based on the way distortions are so nicely centered on the vertices of the polyhedron (rather than distributed concentrically around the point of tangency in the middle of the face), and since I'm merely an interested layperson I have no idea what sort of projection would hold the region of distortion so nicely around a point, or in this case, three points per face.
Apologies for the somewhat rambling comment, but hey I figure it's worth at least asking.
Thanks for your time!
Tobias Jung
Thank for very much! :-)
> I'm wondering though if you know what projection is actually used to map the
> surface to each "pane" or polyhedral face, though?
It’s the Cahill Conformal projection.
I’m just preparing a new blogpost which will show the original AND some other configurations of that projection. I hope it’ll be finished within the next few days, but you already can learn a lot about it (and also about Cahill’s non-conformal projection) here:
http://www.genekeyes.com/CAHIL…
Hope this helps!
Gene Keyes
Tobias Jung
thank you for your comment!
Unfortunately, rendering the projection with the graticule you specified would (for technical reasons) require quite a lot of work, so for the time being, it’s unlikely that I’ll come up with it. Sorry!
J. Rivera
Tobias Jung
Feel free to contact me via e-mail for further details, address given at:
https://map-projections.net/im…
robert malvasio
Before Steve Waterman passed away about 10 years ago he and I were partners selling the map online
Before He passed away I Promised him I would continue to sell the map as long as I could And keep his website online as long as I could afford it
I am 74 years old but I still have an Etsy store selling the map and so if anyone asks you where you can get a copy of the map here is the address
https://www.etsy.com/shop/Wate…
Tobias Jung
no, I didn’t know that the Waterman butterfly map has a copyright, thanks for pointing that out. I just removed all images of it from my website.
robert malvasio
thank you Robert
Tobias Jung
The Waterman butterfly map is back on my site. :-)
daniel
Just pointing up a grammatical error you may wish to address : “ Unfortunately, one land remains teared in two parts: Antarctica”. This should be ….”torn in two”. Not even “torn in two parts”, just “torn in two”.
Tobias Jung
thanks a lot! I just corrected that mistake! :-)
 Except where otherwise noted, images on this site are licensed under
Tobias Jung
thank you for your kind words!
And using my website to teach students about map projections – this is the kind of stuff that makes all the work seem worthwhile, I am honestly thrilled!
Kind regards,
Tobias