
Fri June 08, 2018 News on the Wagner varations
Updated on Fri Mar 06, 2020
This update is all about the projection variations obtained by Wagner’s transformation method called Das Umbeziffern. In case you don’t know what I’m talking about, I’ve written a lengthy article about it.
I’m starting with an announcement that has nothing to do with my web site…
Geocart 3.2
Version 3.2 of the commercial map projection software Geocart is now available. The update includes – among a lot of other new projections – the generalized Wagner which lets you generate customized maps using Wagner’s method.
I think that’s worth mentioning because I wrote quite a lot about the Wagner variations here on map-projections.net. Moreover – and more importantly – because Wagner’s method now (77 years after its introduction and 33 years after his death) is applied systematically in a map projection software. At least, we get the Wagner projections the way they were meant to be!
And yeah, of course, I’ve mentioned »the upcoming Geocart version« on several occasions, e.g. in the Sinucyli projection blogpost – so, now it’s available!
News at WVG-7
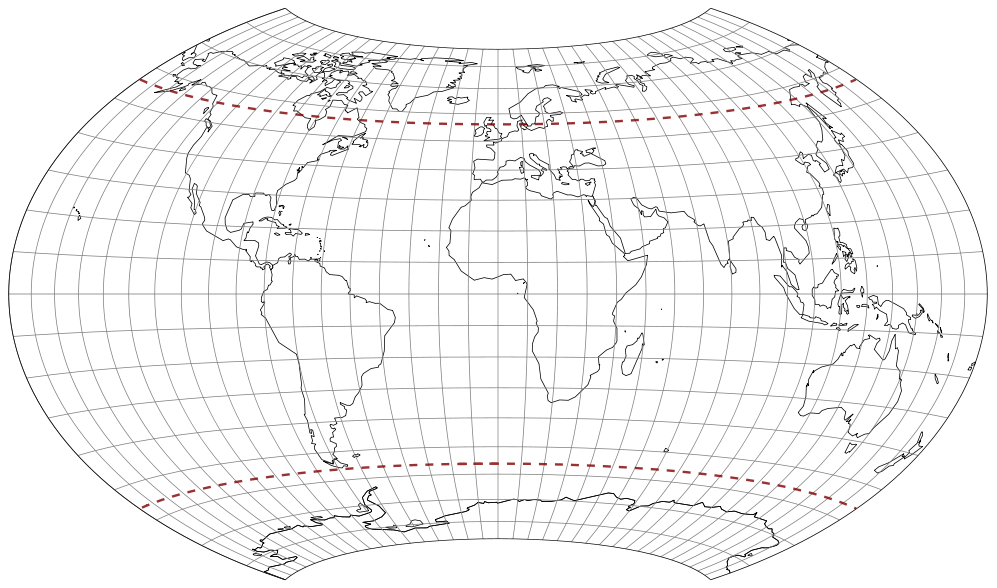
In the Wagner Variations Generator (WVG-7 and WVG-9) you can now set the projections center and the axial tilt. This allows you to create maps like this:


A d3 implementation
In the WVG, I use the d3js.org scripts to render the projections.
But when I release it a year ago, I chose to use a quick&dirty approach:
The values needed for the rendering process were calculated via PHP and then injected into the JavaScript code.
Yuck!
Now, I finally came up with a cleaner solution, in which all calculation are done
with JavaScript (the usual way in the d3 scripts). But:
This still is a preliminary solution, a proof of concept. So far, I didn’t check
if it complies with the d3 coding conventions!
Since November 2018 my implementation is part of d3-geo-projections – well,
after Philippe Rivière had cleaned up and improved
my source code. Thank a lot, Philippe! :-)
But before I get to talk about the actual implementation, I’d like to address Wagner’s method of Umbeziffern briefly, so you can comprehend the parameters used in the script without referring to the detailed description.
Wagner’s idea, presented in 1941, basically consists of using an existing »parent projection«, namely (in case of Wagner VII/VIII)
the azimuthal equal-area projection in the equatorial aspect.
Then …
- a part of the graticule of the parent projection is chosen, bounded by an upper an a lower parallel, and a left and right meridian (65° N/S; 60°E/W for the Wagner VII);
- the entire earth’s surface is mapped onto this part of the graticule;
- the new map is brought back to the original scale of the parent projection;
- and stretched horizontally to the desired ratio of the axes while maintaining equivalence.
The illustration below visualizes the four steps, resulting in the projection nowadays known as Wagner VII (or Hammer-Wagner):

In 1949, Wagner expanded this method by adding the option to apply a controlled areal inflation by noting the amount of inflation at a certain parallel. As example, he decided to use an inflation of 1.2 at 60° N/S, which results in the projection known as Wagner VIII:

So now, be choosing the bounding parallels and meridians, the axial ratio and – in case you don’t need an equal-area
projection – the amount of areal inflation you can generate a set of customized maps.
For example, Dr. Rolf Böhm presented a variation in 2006, setting the bounding parallels to 65°,
the bounding meridians to 84°, the areal inflation at 60° to 1.25,
while the axes remain at the ratio of 1:2. Thus, the result has a shorter pole line, a higher curvature
of the parallels and a slightly increased areal inflation towards the poles than the Wagner VIII.
(On my website, I called this variant Wagner-Böhm I.)
Dr. Böhm also devised a notation to identify any given Wagner variant (and now, we’re slowly crawling towards my d3 implementation) by putting the five parameters that are highlighted above in a row. For the areal inflation and the ratio of the axes he chose to use percentual values so his variant reads: 65-84-60-25-200.
These parameters are referred to (by Wagner himself as well as Dr Böhm) as
ψ1,
λ̅1,
φ1,
S1
and
p (using the same order as above).
- ψ1 is the bounding parallel and determines the length of the pole line: A value of 90 will render a pointed pole, towards zero the pole line will approach the length if the equator;
- λ1, being the bounding meridian, determines the curvature of the parallels: At Zero, they are straight lines (as in a pseudocylindric projection), the max value with the strongest curvature is 180;
- φ1 is the reference parallel for the amount of areal inflation;
- S1 sets the amount of areal inflation at the parallel φ1. As mentioned above, Dr Böhm decided to use a percentual value here, thus 25 means an areal inflation by the factor 1.25. Min value is 0 (= equal-area projection), max value is < 100 (in my implementation: 99.999).
- finally, p sets the aspect ratio of the main axes and again is noted percentually: A value of 200 renders an equator that is twice as long as the the central meridian. p must be greater than 0, technically there’s no max value. Halfway sensible values are somewhere between 50 and 500.
If I failed to explain the parameters comprehensibly, hang on a bit! There’s something coming up that should unconfuse you!
In the d3 implementation, I’m using four of these parameters.
Huh, four? What about the fifth?
I decided to dismiss the parameter φ1,
because you can write any desired areal inflation as value at 60° N/S:
An inflation of 1.6 (or 60 using the Böhm notation) at 70° equals 1.32 (or 32) at 60°.
For simplicity, I decided to always interpret the amount of inflation as »amount at 60° N/S«.
Well, basically it was laziness because it eases validation of the input
parameters a lot.
And now I finally get to the point: Using my implementation, you can generate any possible variation of Wagner VII (equal-area or not) very easily. Here’s the code snippet for the Wagner-Böhm I shown above – at Fil’s suggestion, the variable names were changed to be more descriptive:
d3.geoWagner()
  .poleline(65)
  .parallels(84)
  .inflation(25)
  .ratio(200)
While Wagner indeed worked with these input parameters, the values in the final projection formula
are different. In the article I mentioned before, I called the values
Cx, Cy, m1, m2 and n, following
Gerald I. Evenden’s libproj4.
(In a moment you’ll see why I care to mention that.)
Now, finally on to the actual d3 implementation of the Customizable Wagner:
I’ve provided examples including the full source code.
See https://map-projections.net/d3-customizable-wagner/.
The Static Examples 1 - 4 show the source code that is needed to make it work in the d3 scripts,
in the Interactive Example
you can explore the capabilities of Wagner’s method by dragging a few sliders.
In case you’re feeling confused about the input parameters – this example should clear it all up!
This example also show the values that are passed to the final formula, and updates them on-the-fly.
Have fun!
 Except where otherwise noted, images on this site are licensed under
Comments
Due to spam posts, comments are now subject to moderation, which means they remain hidden until they are approved by a moderator.
More info
Be the first one to write a comment!