Tue Dec 14, 2021 Cupola Projection and the Asymmetric Wagner VII.b
Earth’s land is not equally distributed across the globe – the northern hemispheres contains roughly two thirds of all the landmasses. More importantly, using a projection in the usual equatorial aspect, it’s impossible in the Northern hemisphere to keep all continental areas away from the boundaries of the map, where the distortions usually are very high. There are three ways to deal with this problem:
- You can use an interrupted projection that places the interruptions in a way to keep distortions away from the landmasses. The best known example of this kind is probably the Goode Homolosine (that of course does cut through Greenland, which is why it sometimes has a little extension to deal with the problem, as Mr. Furuti used to show on his sorely missed website).
- You can set a different map center to get away from the usual equatorial aspect, placing the continents in map areas with lower distortion values, as it was done e.g. in the Briesemeister projection.
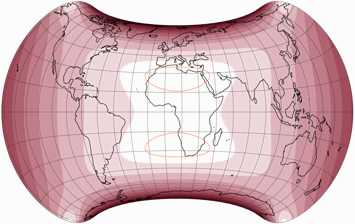
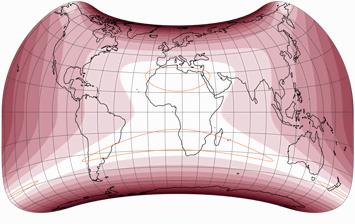
- Or you can use an asymmetric projection, giving the northern and southern hemispheres different shapes and thus, different distributions of distortions – which brings us to the topic. By comparing the symmetrical Strebe 1995 with its asymmetrical brother from 2011, it can be seen very well how the asymmetry leads to providing both hemispheres with an advantageous distribution of distortions:
Of course, you can also combine the these methods: The Bertin-Rivière projection uses asymmetry and a different map center, Cahill-Concialdi combines asymmetry with interruptions, and Danseiji IV even uses all three methods at a single blow. The two projections we’re going to look at, however, only use asymmetry – they have no interruptions, and are shown in the equatorial aspect we are used to.
Cupola Projection
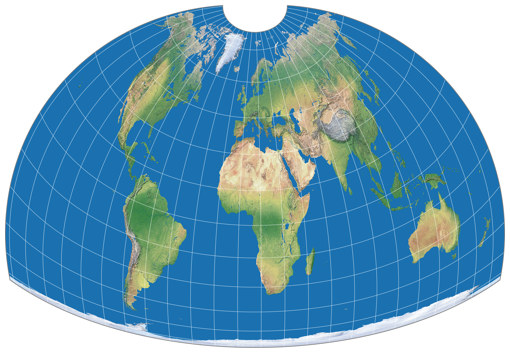
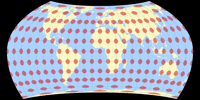
In most equal-area projections, the distribution of angular distortions is more or less like this: The lowest amount of distortion is found at or near the projection center, slowly rising towards the edges – as can be seen in the Strebe example above. But the Cupola projection, introduced in March 2021 by Weia Reinboud[1][2] (and as of today, to be found on my website), is using a different approach.
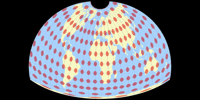
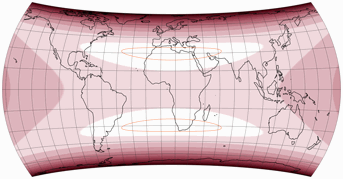
It does not aim to show as much land area as possible with as little distortion as possible. Instead, it tries to reduce the distortion on the continental areas (except Antarctica) near the borders of the map, where the angular deformation usually is the highest. Unfortunately, the only kind of distortion visualization I can generate for this projection is the Tissot indicatrix shown above. The distortion images presented on Mrs. Reinboud’s own website do a better job in showing how well the intended task is fulfilled in comparison to other projections. I would highly recommend you to study them!
The bounding meridian of the Cupola projection is located at 168°58′37″ West
(which is also a portion
of the International Date Line) in order not to cut through
any major landmasses (except Antarctica). Therefore, the central
meridian is at
11°01′23″ East.
Keep in mind that the projection has been optimized for low
distortions using this projection center – setting the center to e.g.
the Greenwich meridian will screw up the optimization to a certain degree.
The Cupola projection is, to my knowledge, the first projection ever that aims at reducing distortions near the borders of the map. The result looks very unusual but, in my opinion, also very attractive. The compact aspect ratio – roughly 1:1.46 –makes it suitable for thematic maps (in case they need to be equal-area) but I think it also is great for decorative wall maps.
Wagner VII.b Asymmetric
In my recent blogpost Happy Birthday, Wagner VII I promised to say a bit more about this projection. I would now like to make good on this promise.
I already showed a projection called Asymmetric Wagner VII in the May article of my 2020 map projection calendar, but now I’ve applied a little modification to that one. But first, let me briefly repeat what I said last year:
– In 1941, Karlheinz Wagner introduced the projection nowadays called Wagner VII. An equal-area projection that (as I’ve mentioned time and again) is customizable regarding the length of the pole line, the curvature of parallels and the aspect ratio of the main axes.
– In 2019, John J. G. Savard created an asymmetric Wagner variant, using the
configuration parameters provided by Wagner but with different settings for the northern and southern hemispheres.
He presented his result on his own website (near the bottom of the page)
and in a posting in the mapthematics forum,
rendered by his own private map projection software.
John stated that he was inspired by the Strebe 2011 mentioned above.
– And in 2020, I added an approximation of John’s work to my map projection calendar.
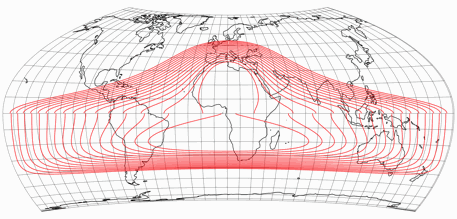
In the course of time, however, I no longer liked this variant so much. Firstly, I felt that it was a bit too wide. Secondly I noticed that there are discontinuities in the distribution of distortions along the equator. Here’s an image showing the isolines of max. angular deformation, from 5 to 20 degree:
So, it’s back to the drawing board. This time, I chose one of Wagner’s
original variants of 1941[3][4] for the northern hemisphere, namely the Wagner VII.b, in Böhm notation:
vii@61-65-60-0-205.128.
For the southern half of the globe, I decided to use the same pole line length
as in my first variant, and the same curvature of parallels as in the northern half.
Then, I only had to find out which aspect ratio of the main axes is to be set to ensure
that both hemispheres will fit together perfectly at the equator.
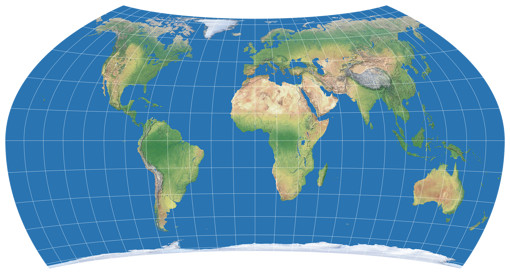
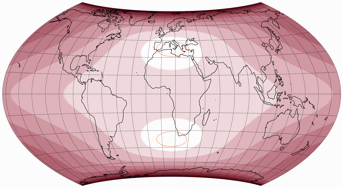
The result is a projection described by the Böhm notation with vii@37-65-60-0-225.76,
you have seen it above.
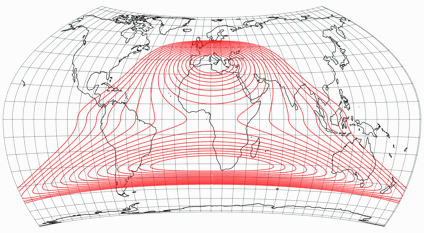
Now, there are no discontinuities at the equator anymore:
Comparing the original symmetric version and my asymmetric one, you can clearly see the improvements for the south:
But an asymmetric projection should be advantageous for both hemispheres. Let’s compare my variant with another symmetric one, in which I applied the configurational parameters of the southern hemisphere to the full map:
Ouch.
Large areas of land in the northern hemisphere also have lower distortions values
in this configuration than in my experiment.
So in this case, you might say: Why bother? Take the symmetric projection with the long pole line,
both hemispheres are served well there! Forget asymmetry!
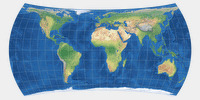
I still prefer the asymmetric projection because on the other, the east-west stretching of the north polar areas looks horrible to me. Perhaps this will become clearer if you compare the two using a “real map imagery”:
However, in terms of overall distortion values, I have to admit that the variant with the long-stretched pole lines is probably better. On the other hand, Wagner has repeatedly expressed his opinion that one should not rely solely on distortion values when evaluating projections. I quite certain he would have disliked the long pole lines. And of course it’s absolutely possible that he would have dismissed my asymmetric version as well…
References
-
↑
Weia Reinboud:
Cupola Projection and its Family
Introduction of the Cupola projection on Reinboud’s website. -
↑
Weia Reinboud:
The cupola projection – an asymmetric equal-area world map
The paper introducing the Cupola projection (paid access) -
↑
Wagner, Karlheinz:
Neue ökumenische Netzentwürfe für die kartographische Praxis.
In: E. Lehmann, ed., Jahrbuch der Kartographie 1941.
Leipzig: Bibliographisches Institut. 176–202. -
↑
Wagner Bros.
My introduction of Wagner’s own four variants of the Wagner VII.



 Except where otherwise noted, images on this site are licensed under
Comments
Be the first one to write a comment!