Sat May 02, 2020 12 Projections for 2020 (Part 5)
To understand what this is about, you should read the intro.
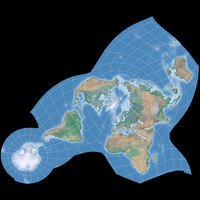
May: Asymmetric Wagner VII
| Asymmetric Wagner VII | |
|---|---|
| Creator |
Wagner (1949) / Savard (2019) … and a bit: Jung (2019) |
| Group | Lenticular |
| Property | Equal-area |
| Other Names | — |
| Remarks | The image doesn’t show a single projection, but a composition of northern and souther hemisphere of two Wagner parameterizations. |
The exact configuration of the projection shown above is my own work, but let’s rush through its predecessors:
– In 1941, Karlheinz Wagner introduced the projection nowadays called
Wagner VII.
An equal-area projection that (as I’ve mentioned time and again) is customizable regarding the length of the
pole line, the curvature of parallels and the aspect ratio of the main axes.
(That’s why there’s also, in my very own nomenclature, the
Wagner VII.b,
Wagner VII.c and
Wagner VII.d.)
– In 1995, daan Strebe created the Strebe 1995, and added an asymmetric “brother” sixteen years later, the Strebe Asymmetric 2011.
– Inspired by the Strebe Asymmetric, John J. G. Savard created an asymmetric Wagner variant in 2019, using the configuration parameters provided by Wagner but with different settings for the northern and southern hemispheres. He presented his result on his own website (near the bottom of the page) and in a posting in the mapthematics forum, rendered by his own private map projection software.
– And then, I tried to re-create John’s work using Geocart.
It doesn’t match exactly but, hey, I wasn’t trying to present Mr Savard’s work in a scientific paper
(in that case, I would have strived to find a closer match),
but looking for a nice unusual projection for my calendar – so it was close enough for my purposes.
That’s the image shown above.
What’s the idea behind asymmetric projections anyway?
Earth’s land is not equally distributed across the globe – the northern hemispheres contains
roughly two thirds of all the landmasses, and when centered to the equator and the
Greenwich meridian (or close to it, e.g. 10° East as I did on the image above),
a lot of land ends up in the “critical parts” of the map, namely close
to the north pole line and in the corners. On the southern hemisphere however,
there’s almost no land in the corners and on the south pole line… well, of course there’s
Antarctica, but being an uninhabited continent (except for some scientific stations),
angular distortions in this region doesn’t matter for a lot maps.
So if you want, for example, an equal-area world map with very low angular distortions in the populated parts of the earth, an asymmetric projection is a good way to achieve the goal because you can take account for the different distribution of landmasses in the hemispheres.
In order to create the image for the calendar, I rendered two maps at the same nominal scale
using the generalized Wagner projection in Geocart, each of them showing only one of the hemispheres.
For the northern hemisphere,
the configuration parameters are:
a = 2.8765, b = 1.133, m = 0.9205, m2 = 1.0, n = 0.3333
For the southern hemisphere:
a = 2.8765, b = 1.7382, m = 0.6018, m2 = 1.0, n = 0.3333.
And then, the two maps were put together seamlessly.
In Böhm notation, that’s vii@67-60-60-0-230 for the north and
vii@37-60-60-0-260.75 for the south, and thus in d3:
d3.geoWagner().poleline(67).parallels(60).inflation(0).ratio(230) and
d3.geoWagner().poleline(37).parallels(60).inflation(0).ratio(260.75).
That’s it for now.
In a recent blogpost I mentioned
that “there have been projections before which were created for academic reasons”.
We’ll see one of them next month.
The best of wishes to all of you!
The topographic images were created with SimpleDEMViewer using ETOPO1 elevation data.
My 2020 Map Projection Calendar
To read another part of my 2020 map projection calendar series, select the desired month.
Comments
One comment


 Except where otherwise noted, images on this site are licensed under
Tobias Jung