Tue Feb 23, 2021 The Canters Projections (Part 1)
Since the day I started map-projections.net it included a bunch of projections developed
by Frank Canters which were introduced in 1989 and 2002.[1][2]
I always planned to write a bit about them, but I never did. 😳
Since I now added six additional Canters projections, I’ll seize the chance
to make good for it.
In advance, I’d like to mention that I’m not using the projection names that Canters used, but the denominations suggested by Dr. Böhm.[3] I’ve given the reasons in the article Naming Canters’ Projections.
The Idea behind the Canters Projections
As I
mentioned recently it’s hard to specify a single value for the overall distortion of a projection,
taking both flation and angular deformation into account, because you’re trying to
bring two different types of distortion to a common denominator.
Therefore, Canters uses a different approach:[4]
(…) the general idea (…) is that all types of distortion that occur on maps can be considered the result of a scale distortion that changes continuously with location and direction. Hence global measures that quantify the distortion of finite distances will provide a good overall idea of the extent to which the plane map differs from the surface that is projected.
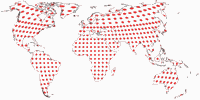
In a nutshell, Canters’ procedure is to measure 5000 randomly selected distances on a map with both start and end points situated on the continental area excluding Antarctica; compare them to the corresponding distances on the globe; calculate the mean distortion of distances and, derived from it, the mean finite scale factor K1.
Canters determined the K1 value for 23 known projections.
But what’s even more interesting here:
If you have a scheme to describe the amount of distortions in projections,
you can also develop new projections, that have especially low distortions
according to this scheme.
And guess what – that’s exactly what Canters did!
He developed several projections with low distortions on – and this is important
so I repeat it – he continental area excluding Antarctica
Before we start looking at Canters’ results, let me try to convey a sense of K1. Here’s a list of a few of the aforementioned known projections and their values. The full list is provided at the end of this blogpost, for the moment it’s sufficient to list the top four, the two best equal-area projections, and the last (i.e. having the largest amount of distortions).
| Projection | K1 |
|---|---|
| Winkel Tripel Bartholomew | 1.1420 |
| Wagner IX.i | 1.1490 |
| Wagner VIII | 1.1490 |
| Kavrayskiy VII | 1.1520 |
| Wagner VII ∗ | 1.1640 |
| Eckert IV ∗ | 1.1670 |
| Cylindrical equal-area φ0 = 0° ∗ | 1.2720 |
| Mercator | 1.3120 |
|
∗ equal-area
Lower values of K1 are better Note: It’s not a typo that Wagner IX.i and VIII show the same value, that corresponds to the information given by Canters. |
|
The Optimised Wagner Projections
As I’ve mentioned in various articles, Karlheinz Wagner developed the means to modify his projections in various ways by a procedure called Umbeziffern. Canters made use of this procedure to find the variations of Wagner’s projections that will show the lowest possible value of K1 (at least, within the confines of Umbeziffern).
We look at them in two chunks.
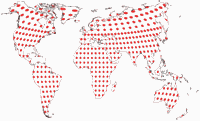
At first, Canters W01, W02 and W06, the optimisations of the pseudocylindric
Wagner I, II and VI, respectively:
What can I say about them? They are, ummm…
They are pseudocylindricals.
Nothing special or surprising here. The only remarkable thing that comes to my mind
is that Canters W06 is very similar to Frančula’s optimisation of Wagner VI, although
they are using different metrics. Compared to the original Wagner projections however,
the Canters variants differ considerably.
Compare Wagner I and Canters W01
Compare Wagner II and Canters W02
Compare Wagner VI and Canters W06
Compare Frančula XI and Canters W06
And here are the images of the Tissot indicatrix as well as the K1 values for the originals and their optimisations:
| Projection | K1 |
|---|---|
| Canters W01 ∗ | 1.1690 |
| Wagner I ∗ | 1.1790 |
| Canters W02 | 1.1610 |
| Wagner II | 1.1650 |
| Canters W06 | 1.1460 |
| Wagner VI | 1.1770 |
|
∗ equal-area |
|
🌐
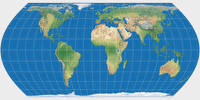
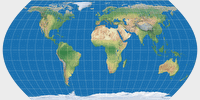
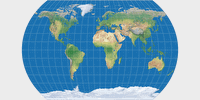
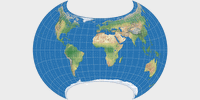
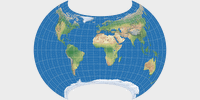
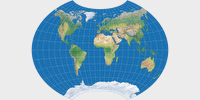
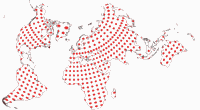
On to the second chunk: The series of lenticular (or polyconic, Canters prefers this term) projections is more interesting in my opinion. Canters W07, W08 and W09 are optimisations of Wagner VII, VIII and IX. On the latter, Canters takes the variant that I have labelled Wagner IX.i as a starting point.
Canters W07 and W08 look quite unusual – but if you inspect the continental areas only,
you’ll see that the angular deformations indeed are comparatively low for an equal-area projection
and a projection with low area inflation. However the shape with the heavily curved pole line
limits their practical use.
The W09 on the other hand is in my opinion a very good choice for atlas cartography or
general use world maps, although for my taste the areal inflation near the poles is already
a bit too much. But I always tend to think that on a projection with equally spaced parallels
(along the central meridian).
Again, here are some links to compare the Canters projection –
with Wagner’s originals and Frančula’s optimisations. On the latter,
only once the results are somewhat similar, the other three are
very different.
And after that, the Tissot indicatrix and the table with K1 values.
Canters W07 vs. Wagner VII
Canters W08 vs. Wagner VIII
Canters W09 vs. Wagner IX.i
Canters W07 vs. Frančula V
Canters W07 vs. Frančula XIV
Canters W09 vs. Frančula IV
Canters W09 vs. Frančula XIII
| Projection | K1 |
|---|---|
| Canters W07 ∗ | 1.1210 |
| Wagner VII ∗ | 1.1640 |
| Canters W08 | 1.1190 |
| Wagner VIII | 1.1490 |
| Canters W09 | 1.1350 |
| Wagner IX.i | 1.1490 |
|
∗ equal-area |
|
The Low-Error-Polyconics
In the previous examples, Canters optimised existing projections within the scope of the Umbeziffern which cannot escape the basic characteristics of the parent projection and therefore limits the options of optimisation. In the following series, he starts out with a new projection build by non-constrained optimisation, resulting in a highly irregular graticule with the lowest possible distortions. Then, he step by step adds certain constraints, which increases the amount of distortions but leads to more conventional graticules.
So here’s the first result, the Canters W10. No constraints. Optimize away! Don’t care whether the map will be usable or not!
Did I mention that Canters optimises the continental areas excluding Antarctica only? 😉
This explains the asymmetry of the graticule: The Northern Hemisphere contains a bit
more than two thirds of Earth’s land. Therefore, it has more weight in the calculation
of the overall distortion value and gets a visibly better representation than the Southern
Hemisphere. And its also quite clear that Antarctica is excluded from the optimisation.
The map is also asymmetric about the central meridian, although this is less obvious.
The K1 value is 1.0465 – and
we won’t get a better one in the following 17 projections!
Of course Canters realised that this projection is not suitable for a
finished map. And so he started adding constraints to the optimisation process.
🌐
On the Canters W11, the constraints are that Eastern and Western Hemispheres
get rendered symmetrical, the equator is straight and equally divided by the meridians.
The result looks like… ummmm… it reminds me of… errrr…
Scratch that.
The result still looks unusual but a lot less so than the W10. The representation of
the landmasses is really fine. It’s probably not suitable for atlas cartography,
but it might even be used for a general use wall map – if you want a map
that looks unusual, has low distortion values
(K1 = 1.1083)
but still retains the layout of the continents as we know it
from conventional world maps.
🌐
Canters W12: The next constraint is symmetry about both
the equator and the central meridian. Now, I’m murmuring: “Almost there”
like the dude in Star Wars Ep. IV because this looks very much
like the world maps we are used to. Canters himself notes
“a substantial distortion of shape in the higher latitudes (E-W stretching)
and close to the equator (N-S stretching)”, but on the other hand,
the stretching near the equator is very much alike the one in
the often-used Winkel Tripel (original version).
I’m not particular fond of this projection, but it’s certainly not bad.
K1 = 1.1178
🌐
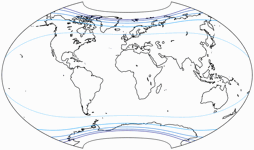
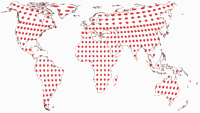
Canters W13: To address the above mentioned shortcomings of the W12, Canters imposes another constraint, namely equally spaced parallels. He points out that projections of that kind “offer a good balance between the distortions of angles and areas and have a pleasing effect on the overall representation of the continents due to the absence of scale variation along the central meridian”.
The result is, except for the pole line, quite similar to the original Winkel Tripel:
Canters W13 vs. Winkel Tripel
Regrettably, Canter only lists the K1 value of the Winkel Tripel Bartholomew,
which is 1.1420 and
thus, gets surpassed by the W13 with
K1 = 1.1315.
🌐
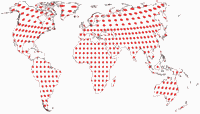
Canters W14:
Finally, the length of the axes is adjusted, so that equator and central meridian
are at their correct ration of 2:1. Compared to the W13, this improves the
shapes in equatorial regions but at the cost of a more substantial East-West-stretching
of the higher latitudes, and Canters concludes:
“Which of the both graticules is to be preferred will depend on the personal
judgement of the map maker.”
The W14 (K1 = 1.1454)
has been used in various Belgian publications, and if you somewhere find a
reference to the Canters projection, then this means they’re talking about
the Canters W14.
To me, both W13 and W14 are great projections which pose a good choice for atlas cartography or general-use world maps. It surprises me that their K1 values fall behind those of the W07 and W08. Of course, the W08 has less areal inflation than W13 and W14, and the W07 has no inflation at all – nonetheless, I wouldn’t have expected this. However, the unusual appearance of W07 & W08 probably stands in the way of their use in the above-mentioned fields of application.
More Visualizations of Distortions
When talking about low-error projections, it’s helpful to visualize the distortions. One kind of visualization has already been given above, the Tissot indicatrices. But here are some more!
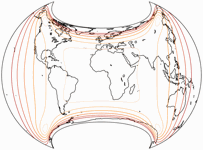
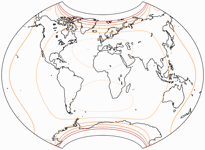
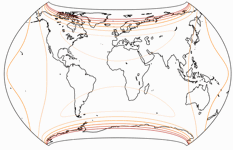
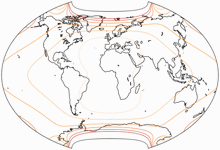
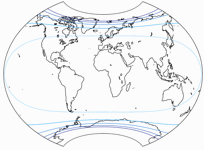
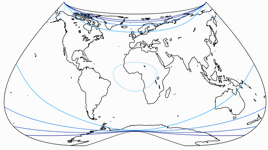
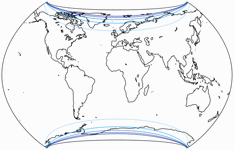
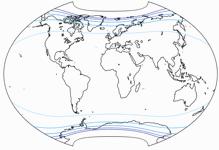
Isolines of Angular Distortions
Regrettably, I lack the tools to
generated images showing isolines of distortion for the projections in question.
(At least, for most of the projections
shown in this blogpost.) Peter Denner stepped in and sent me the images for Canters
W07 to W14 minus W10.
So once more: Thank you, Peter! 🙏
The isolines are given for max. angular deformation of:
10°,
20°,
30°,
40°,
50°,
and 60°.
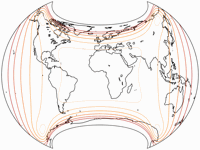
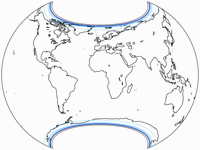
Isolines of Areal Inflation
Again, the following images were created by Peter.
Since the Canters W07 is equal-area, we can omit it here.
The lines are shown at areal inflation values of:
1.5;
2.0;
2.5;
3.0;
and 3.5.
Please note that they are normalized to the value at the central point of the map!
Mostly, these lines are given relative to the nominal scale of the map.
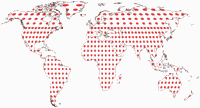
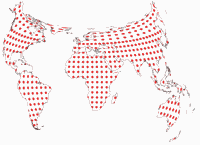
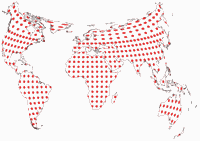
Tissot Indicatrix on Land only
Another representation of the Tissot indicatrices:
Since Canters optimized only on landmasses excluding Antarctica (I did mention that, didn’t I?),
I think it’s helpful to show the Tissot ellipses only in the areas that were optimized. No distractions by the distortions
in the ocean or the wacky shape of the map.
Here’s the full set of all projection we’ve discussed in this blogpost:
List of K1 values
Finally, as promised above, here’s the list of K1 values that Canters determined for 23 known projections, plus the values of the Canters projections I mentioned so far; sorted from best to worst value:
| Projection | K1 |
|---|---|
| Canters W10 | 1.0465 |
| Canters W11 | 1.1083 |
| Canters W12 | 1.1178 |
| Canters W08 | 1.1190 |
| Canters W07 ∗ | 1.1210 |
| Canters W13 | 1.1315 |
| Canters W09 | 1.1350 |
| Winkel Tripel Bartholomew | 1.1420 |
| Canters W14 | 1.1454 |
| Canters W06 | 1.1460 |
| Wagner IX.i | 1.1490 |
| Wagner VIII | 1.1490 |
| Kavrayskiy VII | 1.1520 |
| Robinson | 1.1540 |
| Canters W02 | 1.1610 |
| Wagner VII ∗ | 1.1640 |
| Wagner II | 1.1650 |
| Eckert IV ∗ | 1.1670 |
| Canters W01 ∗ | 1.1690 |
| Wagner VI | 1.1770 |
| Wagner I ∗ | 1.1790 |
| Wagner IV ∗ | 1.1790 |
| Eckert VI | 1.1810 |
| Cylindrical equidistant φ0 = 30° | 1.1810 |
| Mollweide ∗ | 1.1990 |
| Aitoff | 1.2010 |
| Cylindrical equal-area φ0 = 30° ∗ | 1.2030 |
| Hammer ∗ | 1.2140 |
| Cylindrical equidistant φ0 = 0° | 1.2170 |
| Miller II | 1.2280 |
| Miller I | 1.2460 |
| Sinusoidal ∗ | 1.2630 |
| Cylindrical equal-area φ0 = 0° ∗ | 1.2720 |
| Mercator | 1.3120 |
|
∗ equal-area |
|
Sometime soon …
In Part 2, we’ll discuss W15 to W21, W23 and W30 to W34.
Stay tuned!
References
-
↑
Frank Canters:
New Projections for World Maps, a Quantitative Perceptive Approach.
Cartographica, 26, 53 - 71, 1989.
doi.org/10.3138/6212-46V4-655U-766K (Paywall) -
↑
Frank Canters:
Small-scale Map Projection Design.
London & New York 2002. - ↑ Dr. Rolf Böhm: The Canters Index
- ↑ Canters 2002, page92.










 Except where otherwise noted, images on this site are licensed under
Comments
Be the first one to write a comment!