
Fri Jan 01, 2021 14 Projections for 2021 (Intro)

Each year, I build a small map projection calendar – last year, I wrote about it in greater detail. Let me quote myself:
(…) I just try to put together an interesting mix of different projections. Different in their appearance, but also from different groups and having different properties. I try not to repeat myself, so I don’t select projections that have been in one of the previous calendars – except I show a different aspect or different configuration.
Of course, by this time it’s getting hard to find another 12. Yes, there are hundreds of projections but for example I really don’t have to show each and every pseudocylindrical.
Additionally, the choice is limited by my preference to show only projections that I like aesthetically or are at least interesting in some way. This year I realized that I just can’t avoid to repeat myself anymore – that I just had to show one or the other projection I already had a few years ago. At least didn’t want to repeat any of last years’ projections, and to present the repeated projections using a different imagery than I used at that time.
And then I thought: If there have to be recurrences, at least let there be a good reason for it!
So I came up with the idea of showing projections that show particularly low distortion values.
And now I feel compelled to write …
A Brief Introduction to Distortion and its Measurement
All map projections have distortions. Some distort scale, others distort shape, many distort both. The amount of distortion changes across the map: Somewhere, there’s a point which has no or little distortion. While you move away from that point, the amount of distortion while grow continuously. The variation in relative area measure (the flation) can be measured easily; both for a single point on the earth’s surface and in the form of an average value for the whole map. The same applies to the deformation from the shapes, the angular deformation.
Now, we would like to have a single value that includes both flation and angular distortions, so that you can say: This or that projection has the lowest overall distortions of all projections. But this is not easy: how can you bring two different types of distortion to a common denominator? You can only do that by making arbitrary decisions about how to weigh them against each other. And so different kinds of metrics, different comparison schemes have been developed. Each has its merits and deficits. Each ranks the overall distortion of a selection of maps differently. A map creator can modify an existing or a newly created projection so that it has particularly low distortion values according to one of these metrics, a so-called optimisation. If you apply a different metric, the same projection may show higher values.
All the maps in the 2021 calendar have low distortion values according to one comparison scheme or another, some are optimisations. And because they are measured differently, the resulting projections also look different.
Now, this was a very brief introduction to distortions. If you care to know more, refer to daan Strebe’s excellent posting On distortion and optimal projections and read at least up to the sentence: “Nevertheless, we really seem to want answers about which projection is better, so we keep trying.“
Anyway, now I’ve got a good reason for the recurrences:
they simply cannot be missing in a list of low-distortion projections.
Problem solved! 😉
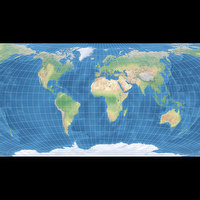
The Frontispiece of the 2020 Calendar
After I had decided on the theme of the calendar, I started choosing appropriate projections, and soon I had a collection of 18. So I sorted out some, and when I had decided on the final twelve, I realised that I had 11 lenticular projections and one of the “miscellaneous” group. I thought that I should throw in one or two pseudocylindricals as well – and to avoid going into the decision-making process again, I made it easy for myself and put them on the frontispiece, which is presented at the top of this blogpost.
It shows a classic – the Kavraiskiy VII, created in 1939 by Vladimir V. Kavraiskiy –
and a modern projection, the Györffy A (János Györffy, 2018). Both have equally spaced
parallels, but while the Kavraiskiy VII has a pole line, the Györffy A
has pointed poles.
Since Kavraiskiy’s projection was introduced 80 years ago, it’s not surprising that it has
been evaluated by various comparison schemes:
- It took rank 6 in a list of 100 projections sorted by Richard Capek’s distortion characterization Q in 2001; [1]
- rank 4 in a list of 23 well-projections sorted by the mean finite scale factor K1; [2]
- rank 3 in Goldberg’s and Gott’s (2007) list of 6 projections “with the lowest values of ∑ε” (which is an example of how distortions characteristics can be condensed into a single rating value, clearly stating the problems of this approach); [3]
- also rank 3 in both Frančula’s (1971) list of 10 frequently used projections, sorted by the Airy-Kavraiskiy criterion EAK; [4]
- and Györffy’s list of the related EK value for well-known 18 projections. [5]
Györffy’s projection was introduced in the latter paper of 2018, so to date there’s (as far as I know) only the distortion value provided by Györffy himself: The Györffy A was noted with EK = 0.36756, narrowly outpacing the Kavraiskiy VII with EK = 0.3693 (lower values are better here).
So I guess you can say that both projections fulfil the requirements of having low distortion values.
The projection for January will be another classic.
See you soon!
References
-
↑
Richard Capek, 2001:
Which is the Best Projection for the World Map?
icaci.org/files/documents/ICC_proceedings/ICC2001/icc2001/file/f24014.pdf -
↑
Frank Canters:
Small-scale Map Projection Design.
London & New York 2002. -
↑
Goldberg & Gott, 2007:
Flexion and Skewness in Map Projections of the Earth
physics.drexel.edu/~goldberg/projections/goldberg_gott.pdf - ↑ Nedjeljko Frančula: Die vorteilhaftesten Abbildungen in der Atlaskartographie (German)
-
↑
János Györffy, 2018: Minimum distortion pointed-polar projections for world maps by applying graticule transformation
doi.org/10.1080/23729333.2018.1455263
My 2021 Map Projection Calendar
To read another part of my 2021 map projection calendar series, select the desired month.


 Except where otherwise noted, images on this site are licensed under
Comments
Due to spam posts, comments are now subject to moderation, which means they remain hidden until they are approved by a moderator.
More info
Be the first one to write a comment!