
Fri Mar 26, 2021 Completing Canters and Györffy, Own Projections
Today, I’ve got:
– nine projections that I wanted to add for quite some time now,
– one that I have been asked for,
– two new projections of my own, and as a consequence thereof, two changed names.
Completing Canters Projections
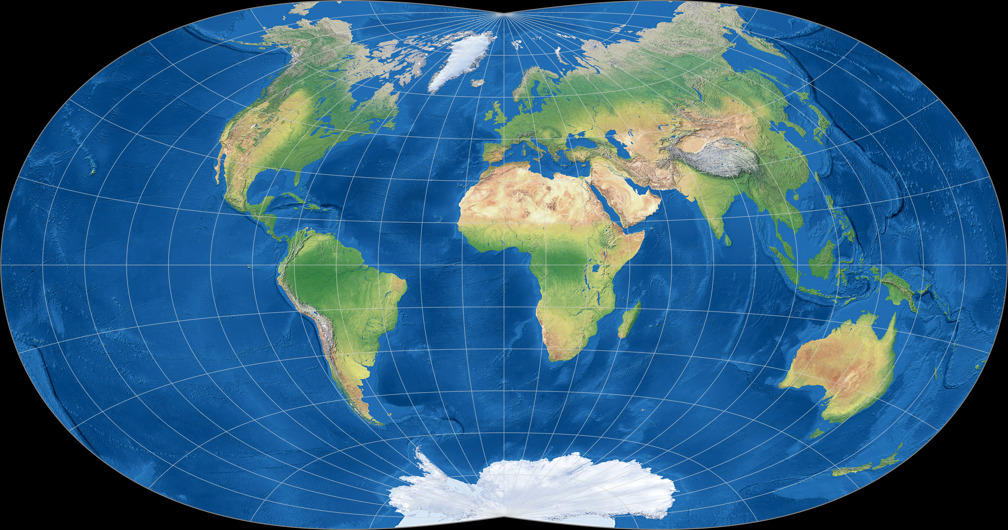
I’ve added the last missing world map projections by Frank Canters.
Once more I’d like to point out that I’m using the names that were
suggested by Dr. Böhm (sorry,
that site is mostly in German) for reasons I gave in an
article I wrote a few years ago.
Böhm didn’t use a gapless numbering, seemingly missing projection (e.g. W03 to W05) do not exist.
Please note that the rendition of W23 I’m showing doesn’t match the original to 100% but is very close.
More about that (and about the other new Canters projections) is covered
in the second part of “The Canters Projections”.
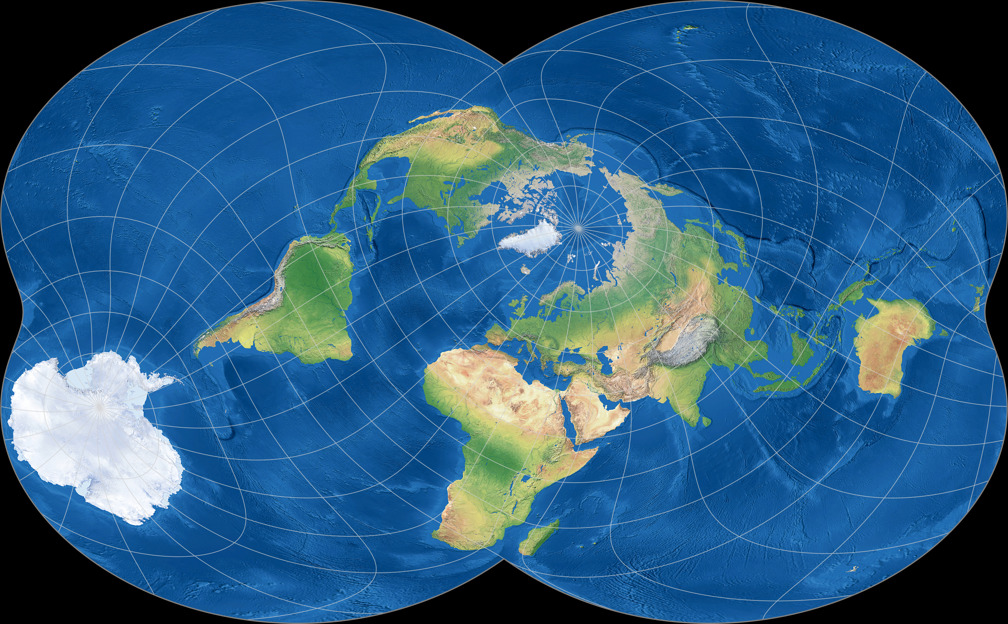


Completing Györffy Projections
Two years ago I
added the Györffy E to my website – but János Györffy introduced five projections[1],
namely A, B, D, E and F (variant C was abandoned by the creator and so it
won’t be listed here either).
Now I’ve got all five of them – and at some point in the future I’ll
write a bite more about them.


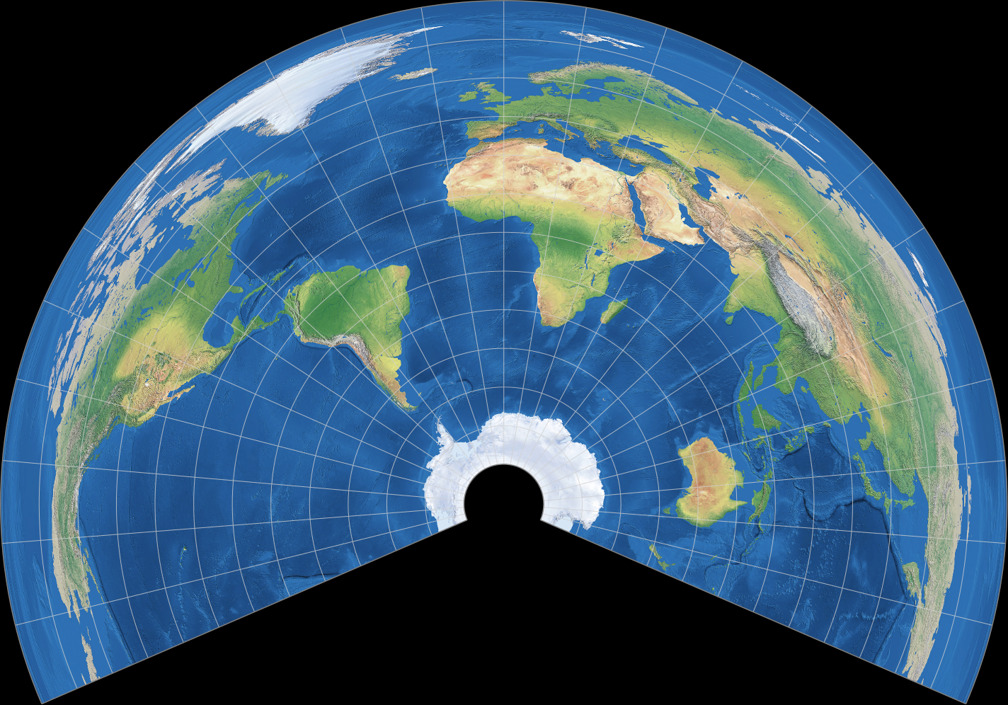
Conical Map in Southern Aspect
On a single request, I added a Southern aspect of the 20/60 Equidistant Conic, with standard parallels at 20° and 60° South. It’s probably nothing anyone would want to use for a world map. If nothing else, it shows that conical projections are rarely recommendable to map the whole globe, they play to theirs strengths on regional maps.
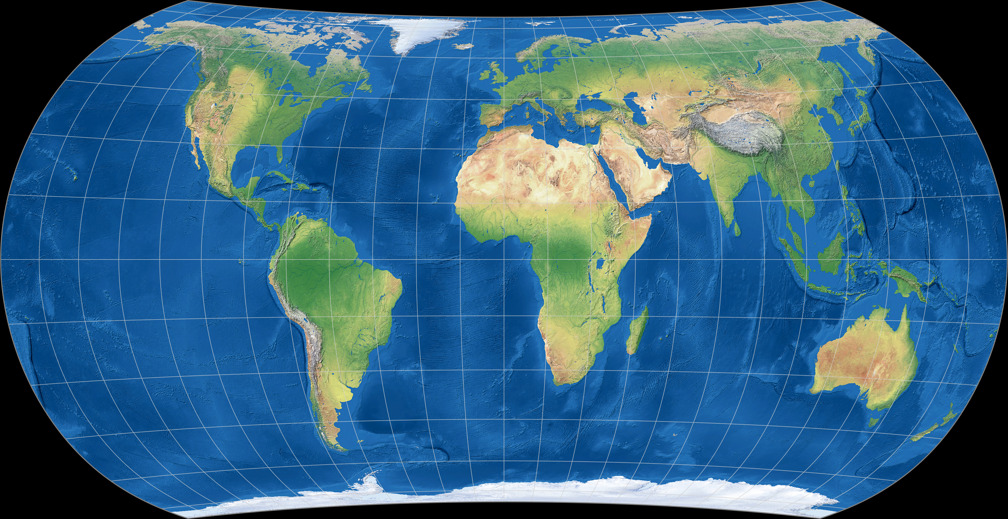
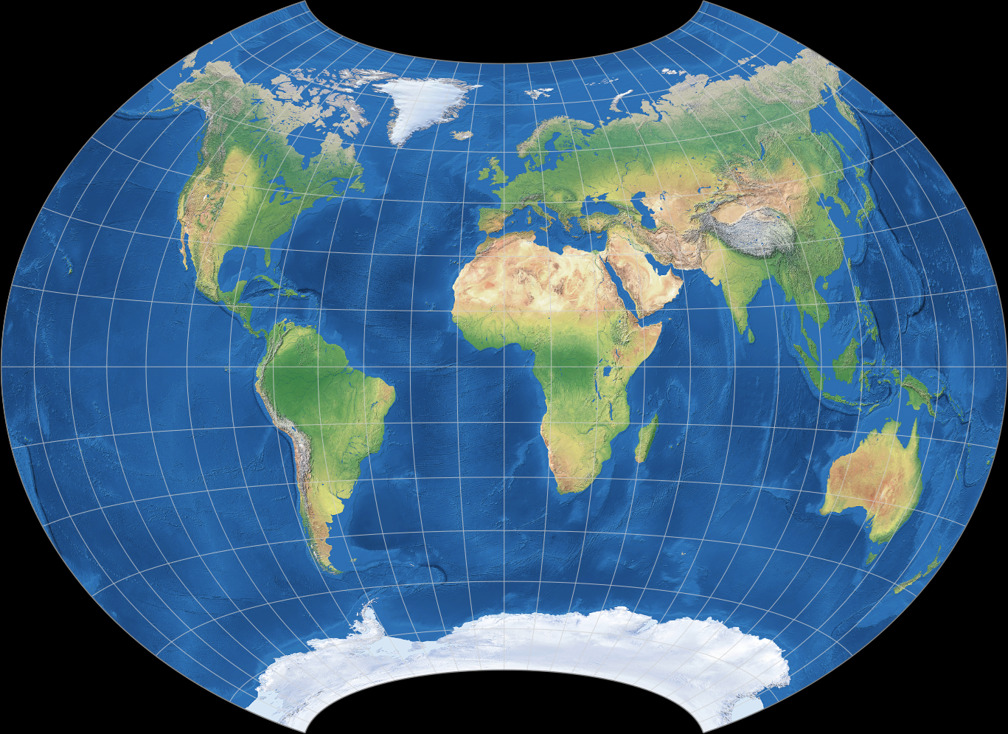
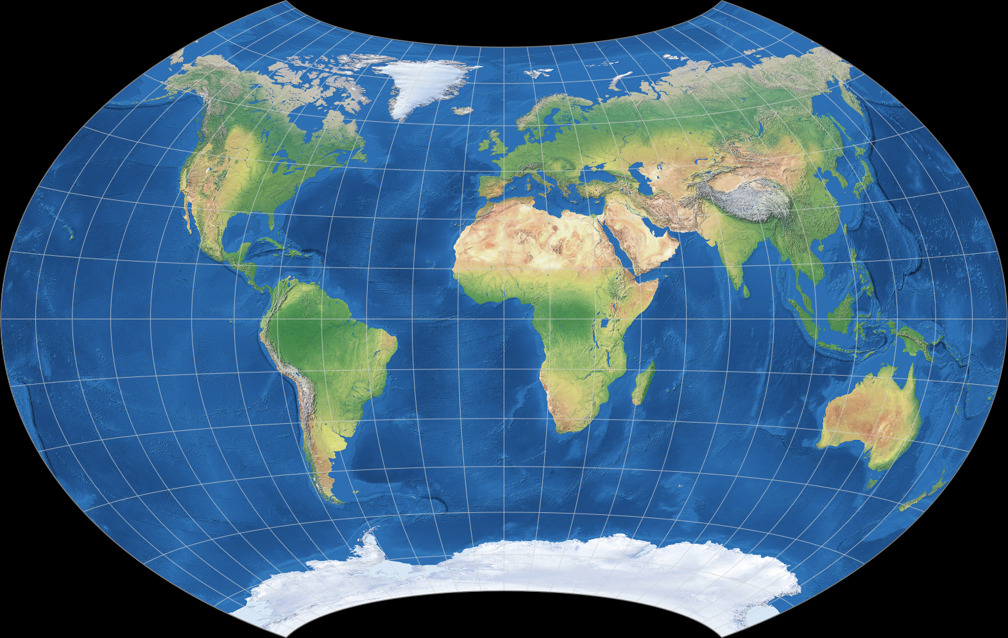
The CW09 Copycat
Some time ago, I introduced a copycat of Frančula XIII – and now, I’m doing the same with Canters W09: An almost identical exterior shape, but the parent projection is Wagner VIII instead of Wagner IX and the amount of areal inflation was reduced. The result ist the CW09 Copycat:
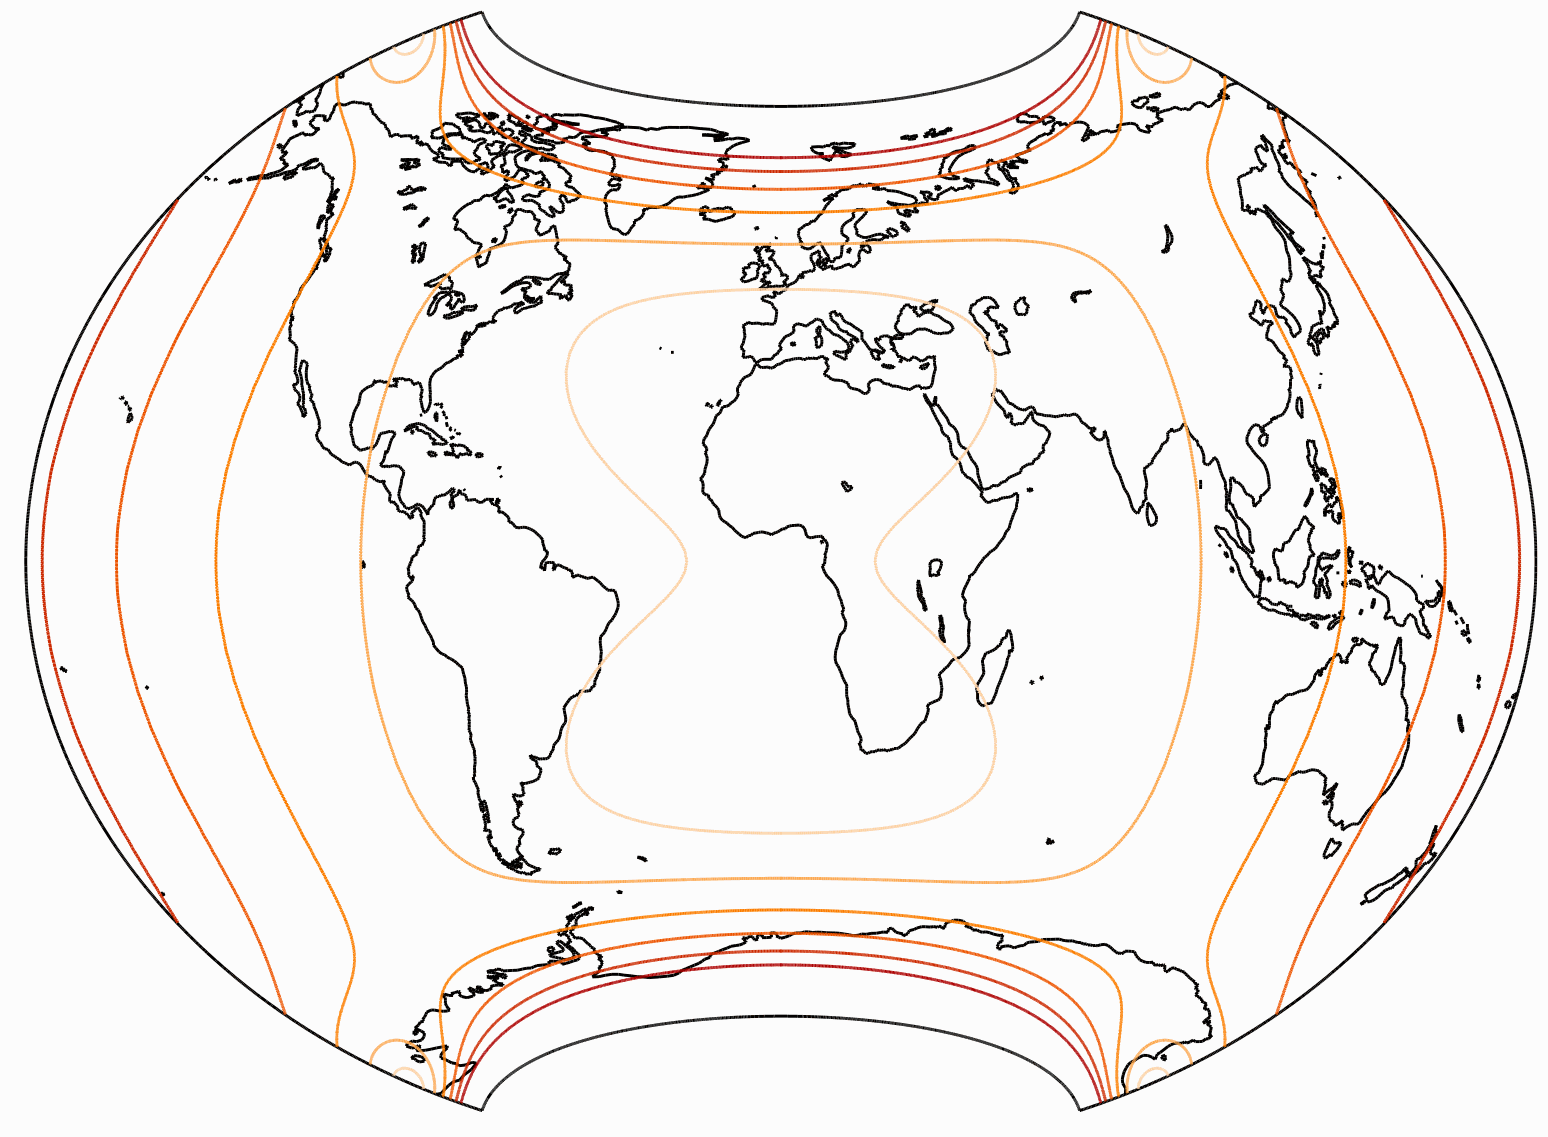
Let’s have a look at the distribution of distortions, compared to the original – firstly, the areal inflations:


The lines are shown at areal inflation values (normalized to the value at the central point of the map) of:
1.5;
2.0;
2.5;
3.0;
and 3.5.
You can see that the areal inflation is lower indeed on the W09 Copycat. Moreover I prefer the distribution of inflations – in any variant of the Wagner VII/VIII, the isolines run along the parallels. When asked about it, you just have to say: The projection is equivalent along the equator, inflations rise with every degree of latitude.
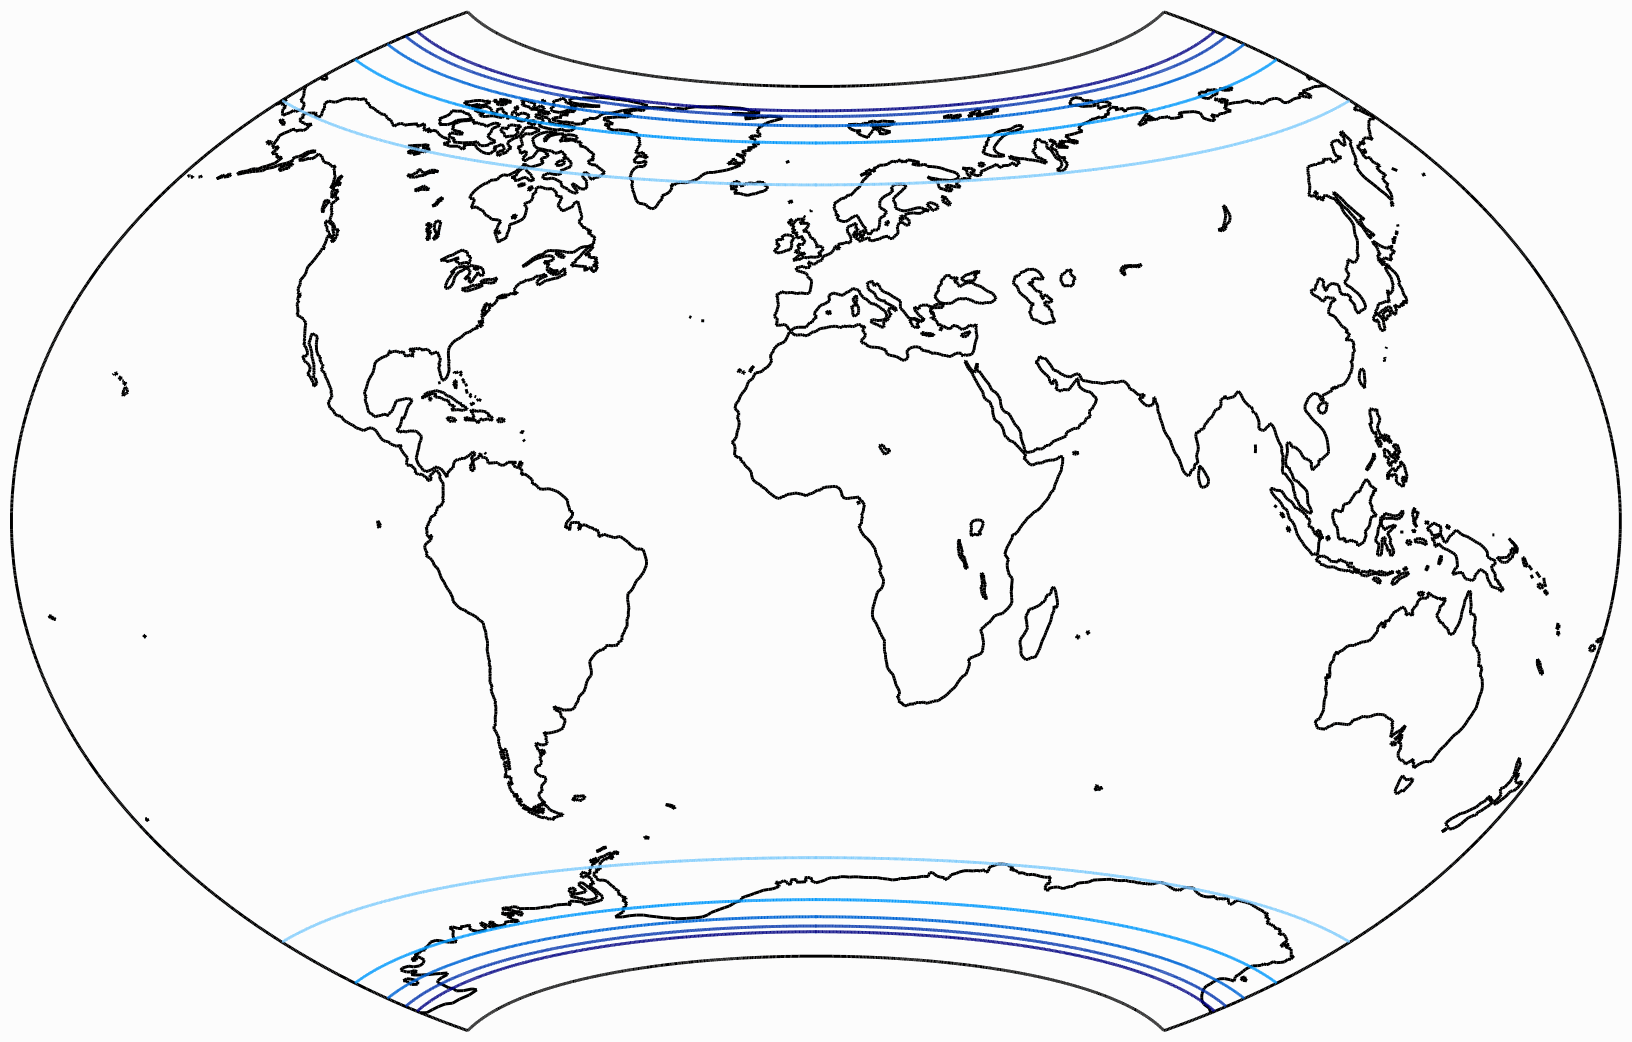
Alright, chances are you will never be asked about it. So that’s a small advantage, and it comes at a price. Look at the angular deformations:

The isolines are given for max. angular deformation of:
10°,
20°,
30°,
40°,
50°,
and 60°.
While in the map center you still might argue which kind of distribution is to be preferred, the Canters W09 is clearly better on the rest of the map. And for Australia, you don’t even need isolines to tell that it is way more distorted on the Copycat.
All in all, I guess the original is the better projection.
However the Copycat is not too bad anyway, according to
Goldberg and Gott’s metric, it beats the Winkel Tripel.
Compare Canters W09 and CW09 Copycat
Wagner BCW-A I, II and III
The Wagner BCW-A, that I
introduced two years ago,
was renamed to Wagner BCW-A I
(that’s the roman numeral 1, not the uppercase variant of the letter i).
The Wagner vii@65-76-60-40-168, that I
introduced one year ago was renamed to Wagner BCW-A III –
it deserved a catchier name, because among my own “non-copycat” projections
it is the one with the most favourable distortion values (by different metrics,
nameley Airy-Kavraiskiy, Goldberg & Gott, Capek’s Q).
And as you probably guess by now, there’s also a new variant that I called
Wagner BCW-A II:
So why did the new variant get the numeral II when the projection that now gets the III was introduced earlier? Well, looking at the values of the Böhm notation[2] and their appearance, I found this order more logical:
| Projection | Böhm notation | |
|---|---|---|
| Wagner BCW-A I | 67-80-60-27-190 |

|
| Wagner BCW-A II | 65-85-60-35-185 |
|
| Wagner BCW-A III | 65-76-60-40-168 |

|
To sum up, the BCW-A II has a more pronounced curvature of the parallels than the other two –
regarding the areal inflation and the horizontal compression, both are higher than in I but lower than in III.
Therefore, it seemed appropriate to me to number the three projections in the manner shown.
Let’s have a look at the areal inflations (normalized to the value at the central point of the map) of the three variants:


Alright. There are three or four other projections that I wanted to add,
but I’ll leave it at that for now.
So long!
References
-
↑
János Györffy: Minimum distortion pointed-polar projections for world maps by applying graticule transformation
doi.org/10.1080/23729333.2018.1455263 -
↑
Wagner’s Umbeziffern and the Böhm notation:
map-projections.net/wagner-umbeziffern.php
 Except where otherwise noted, images on this site are licensed under
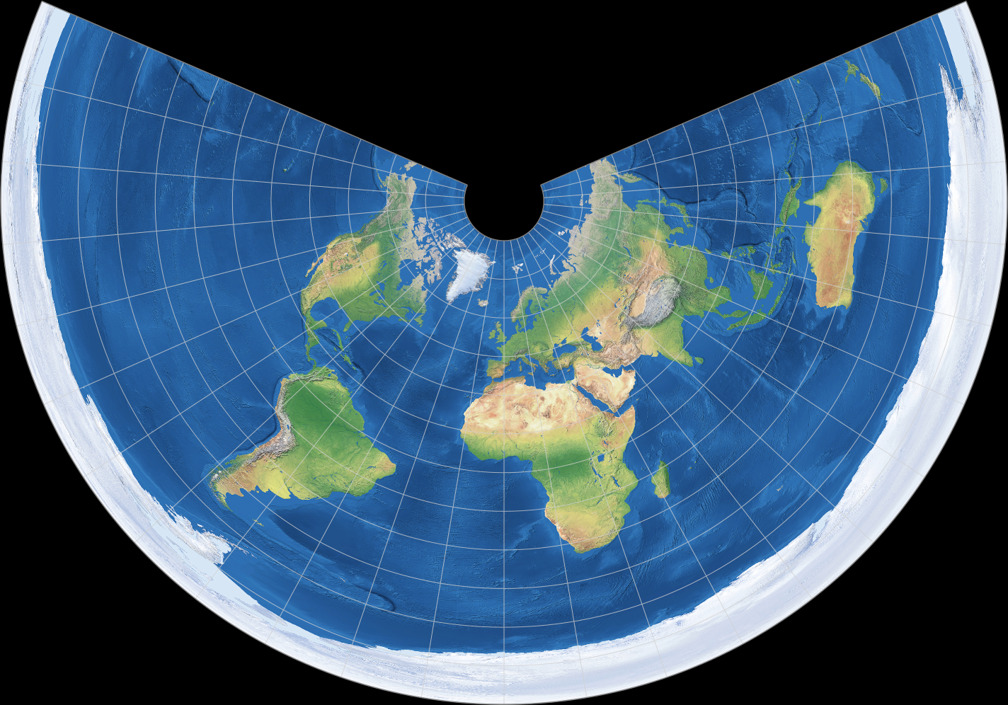
Comments
Due to spam posts, comments are now subject to moderation, which means they remain hidden until they are approved by a moderator.
More info
Be the first one to write a comment!