Sat Jan 01, 2022 13 Projections for 2022 (Intro)
A collection of my own experiments
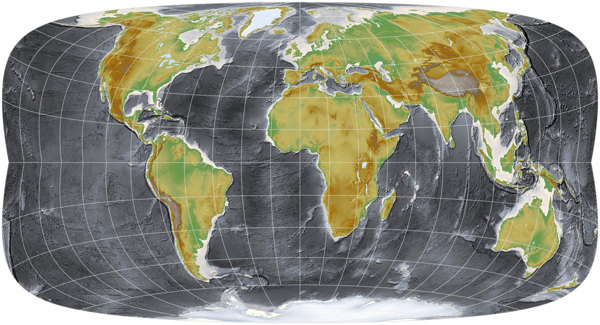
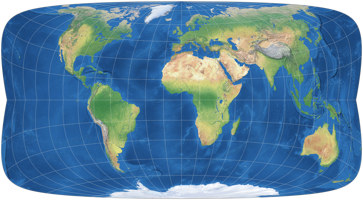
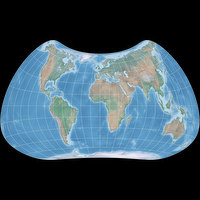
Frontispiece: Strebe-Mollweide 24°S
| Strebe-Mollweide 24°S | |
|---|---|
| Creator | Daniel »daan« Strebe (1992) |
| Group | Lenticular |
| Property | Equal-area |
| Other Names | — |
| Remarks | Transformation of the Mollweide projection, using Bonne φ1 = 24°S. Read my blogpost for more information. |
Each year, I build a small map projection calendar – two years ago,
I wrote about it in greater detail.
And meanwhile, I’ve got the problem that it’s hard to find enough projections
that haven’t been presented in one of the previous years. Last year,
I had the idea to give the calendar a certain theme
(projections with low distortion values), so when I repeat projections,
then at least I would have a plausible excuse.
And guess what – I’m doing it again. But this year
I’ll present 13 of my own experiments in the field of map projections.
I deliberately chose the subtitle “A collection of my own experiments”. Because unfortunately, I lack the mathematical knowledge to develop completely new projections. But: Some projections can be edited using appropriate software. Or you can combine two different projections. That’s what I did, and some of my results are presented in this calendar.
And sometimes, it’s even a bit bold to call it “my” experiment. For example the frontispiece projection above: When daan Strebe developed it, he provided a parameter to configure it, called the Bonne φ1. And all that I did was to enter a value (namely 24° South) that resulted in a projection which looked quite different from the default rendering. That’s not a lot of creative work on my part, is it?
So while I have contributed a little to the final projection, please always remember: the real credit always goes to the original author!
Having settled that, I would like to explain why I included this experiment, Strebe-Mollweide 24°S, in the calendar. I already said it a while ago: For some reasons, people seem to love rectangular world maps. Just google for comments regarding the AuthaGraph map (which, by the way, isn’t equal-area) and soon, you’ll stumble across someone who is praising the map and says: “And it’s rectangular, too!”
Well, of course this projection is not rectangular, but it is, ummm, cautiously crawling towards approaching a rough approximation of an almost rectangular shape. Heh.
Alright, it’s not rectangular.
But this deviation from the rectangle allows for a shape of the continents,
which I find much more pleasing in large parts of the map,
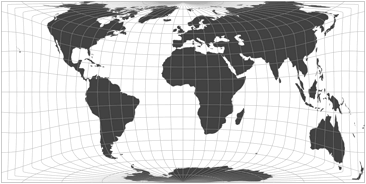
if you compare it to a really rectangular projection of almost
the same aspect ratio, namely the
cylindric equal-area projection with standard parallels at 40° North/South:
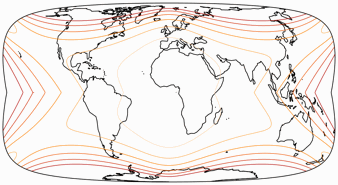
Let’s have a look at a visualization of angular deformations –
with isolines for max. angular deformation of:
10°, 20°, 30°, 40°, 50°, and 60°.
Granted, the distortions near the poles do get hairy, especially for Canada and Alaska, Northern and Eastern Siberia. Nonetheless I think the distribution of distortions is not too bad if an close-to-rectangular equal-area projection is what you want.
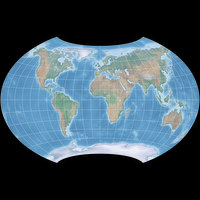
And while I was writing this blogpost, it occurred to that there is another really rectangular equal-area projection, which even shows certain similarities to the Strebe-Mollweide 24°S. It’s the Gringorten projection – which usually is shown like this or like this or even like this –, but this time, with a little bit of Umbeziffern:
… but now, it’s too late to add this to the calendar.
Damn.
😉
The projection of the first calendar sheet will be shown around mid-January.
After that I hope that they will always be presented in the first days of each month.
I wish you all the best for 2022!
My 2022 Map Projection Calendar
To read another part of my 2022 map projection calendar series, select the desired month.






 Except where otherwise noted, images on this site are licensed under
Comments
Be the first one to write a comment!