
Sun Jan 03, 2021 14 Projections for 2021 (Part 1)
If you wonder what this is about at all, you probably didn’t read the intro.
January: Ginzburg V

| Ginzburg V | |
|---|---|
| Creator | G. A. Ginzburg (1950) |
| Group | Lenticular |
| Property | Compromise |
| Other Names |
|
| Remarks | — |
The Ginzburg V was developed in 1950 to be used in Soviet school atlases[1] but remained rather unknown apart from that. Which is regrettable, in my opinion it’s a very elegant,
attractive projection.
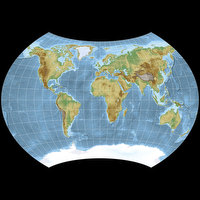
It certainly doesn’t look too horribly unfamiliar because its “look & feel” it quite
similar to the famous Winkel Tripel:
Compare Ginzburg V and Winkel Tripel.
However, this calendar is about projections that show particularly low distortion values
according to one or the other comparison scheme. Unfortunately to my knowledge
the Ginzburg V has been surveyed only once, namely by Richard Capek[2] when
he introduced his distortion characterization Q in 2001, where it took the
pole position of a hundred projections!
Granted, since then a bunch of projections with minimized distortion values have been developed
so it’s not unlikely that the Ginzburg V meanwhile has been outpaced – and Q does have
its drawbacks (I guess I’ll have to write about that at some point in the future),
but still that’s a good start for my collection of low distortion projections.
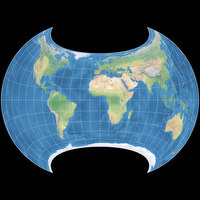
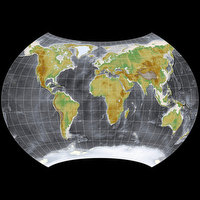
Let’s have a look at the distortion visualizations:


Lighter hues mean less distortion. Darker hues mean more distortion.
On the areal distortions, the red lines mark values of 1.0 (= equal-area, no distortions; the dashed line), 1.2 and 2.0.
On the angular deformations, the red lines mark distortion of 20° (the dashed line), 40° and 80°.
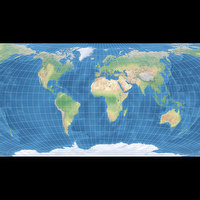
A word about the map image:
A short while ago, I found a rendering of the Lagrange projection
on John G. Savard’s great map projection website
which used the
NOAA ETOPO2: Topography and Bathymetry dataset.
I instantly liked the black/dark grey oceans but I was not so fond of the way the continents look.
So I modified one of my own elevation maps, created with the help of
Simple DEM Viewer,
to have oceans in the same style, and projected it to Ginzburg V with
Geocart.
I like this image a lot! It probably would be difficult to handle for a real world maps with labels,
but I think it’s great for decorative matters.
Next month, we’ll see one of the aforementioned “bunch of projections with minimized distortion values”.
References
-
↑
Snyder, John P.:
Flattening the Earth: Two Thousand Years of Map Projections.
Chicago 1993, page 248. -
↑
Richard Capek, 2001:
Which is the Best Projection for the World Map?
icaci.org/files/documents/ICC_proceedings/ICC2001/icc2001/file/f24014.pdf
My 2021 Map Projection Calendar
To read another part of my 2021 map projection calendar series, select the desired month.


 Except where otherwise noted, images on this site are licensed under
Comments
Due to spam posts, comments are now subject to moderation, which means they remain hidden until they are approved by a moderator.
More info
Be the first one to write a comment!