Sat Nov 06, 2021 14 Projections for 2021 (Part 11)
If you wonder what this is about at all, you probably didn’t read the intro.
November: Canters W11
| Canters W11 | |
|---|---|
| Creator | Frank Canters (1989) |
| Group | Lenticular |
| Property | Compromise |
| Other Names |
|
| Remarks | Please regard Naming Canters’ Projections. Also see my blogpost about the Canters projections, part 1 (W01 - W14) and part 2 (W15 - W34). |
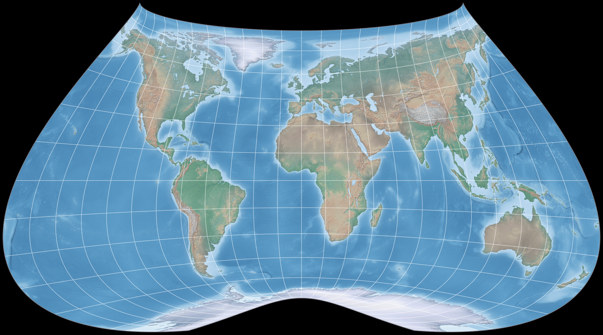
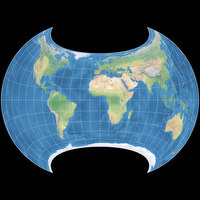
Out November projection is Canter W11 that I
briefly mentioned in my blogpost about Canters’ projection series
(see link in the Remarks of the table above).
You might think that it’s a wacky projection – and yes, it is,
but it’s only the outer shape that makes it look unusual.
If you concentrate on the shapes and sizes of the continents,
you’ll see that it’s actually a projection with very low
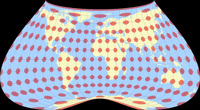
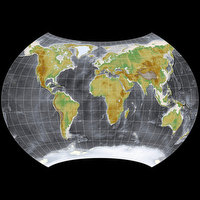
distortions. Look at the Tissot indicatrix – one for the full map
and one the optimized parts only:
Especially in the second image, where there’s not distraction from the strange outer shape, you’ll see the benefits of the W11. Consequentially, it came fifth in the list of K1 values (Canters’ own distortion metric) – after W10 (which is really wacky), and W23, W20, W21 which are oblique projections and therefore suitable for general use only to a limited extent. So at least according to this metric (which regards distortions on continental areas except Antarctica only), it is an excellent projection.
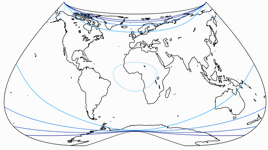
However, the good impression is also confirmed when you look at the
distribution of the distortions –
below, there are images showing isolines of angular deformations
and areal distortions, provided by Peter Denner.
The isolines are given for max. angular deformation of:
10°, 20°, 30°, 40°, 50°, and 60°.
For the areal inflation, shown normalized to the value at the central point of the map,
the lines represent values of:
1.5; 2.0; 2.5; 3.0; and 3.5.
In summary, I can say that the Canters W11 should only be used with caution because of its unusual shape – but it definitely fulfils the theme of this year’ calendar (projections with low distortion values).
… and in the latter regard, I have to admit that the projection
I chose for the December sheet failed. So I’m going
to cheat next month and show a projection that fares better.
But at least it’s going to be a “kinsman” of the original
December projection. 😉 Of course, I’ll also explain how this mistake could have happened.
TTFN!
My 2021 Map Projection Calendar
To read another part of my 2021 map projection calendar series, select the desired month.









 Except where otherwise noted, images on this site are licensed under
Comments
Be the first one to write a comment!